
Indeed Experiments
New A/B testing framework for product managers.
01 Scope
A redesign of the internal tools used for running A/B experiments at Indeed.
02 My role
Conducted discover research
Defined UX Strategy
Led end-to-end UX/UI
Organized 2 design sprints
03 Team
Internal Platform
Tokyo, Austin, California
30 devs, 2 PMs, 1 UX, 1 UX developer
CONTEXT & USERS
Product teams run experiments to A/B test product improvements.

Product manager (PM)
Run experiments
Monitor metrics
Communicate with other teams

Developer
Execute experiments
Communicate with PM about the experiments

Observer
Monitor metrics
Stay informed of experiments
Roles: country managers, senior leaders, etc.
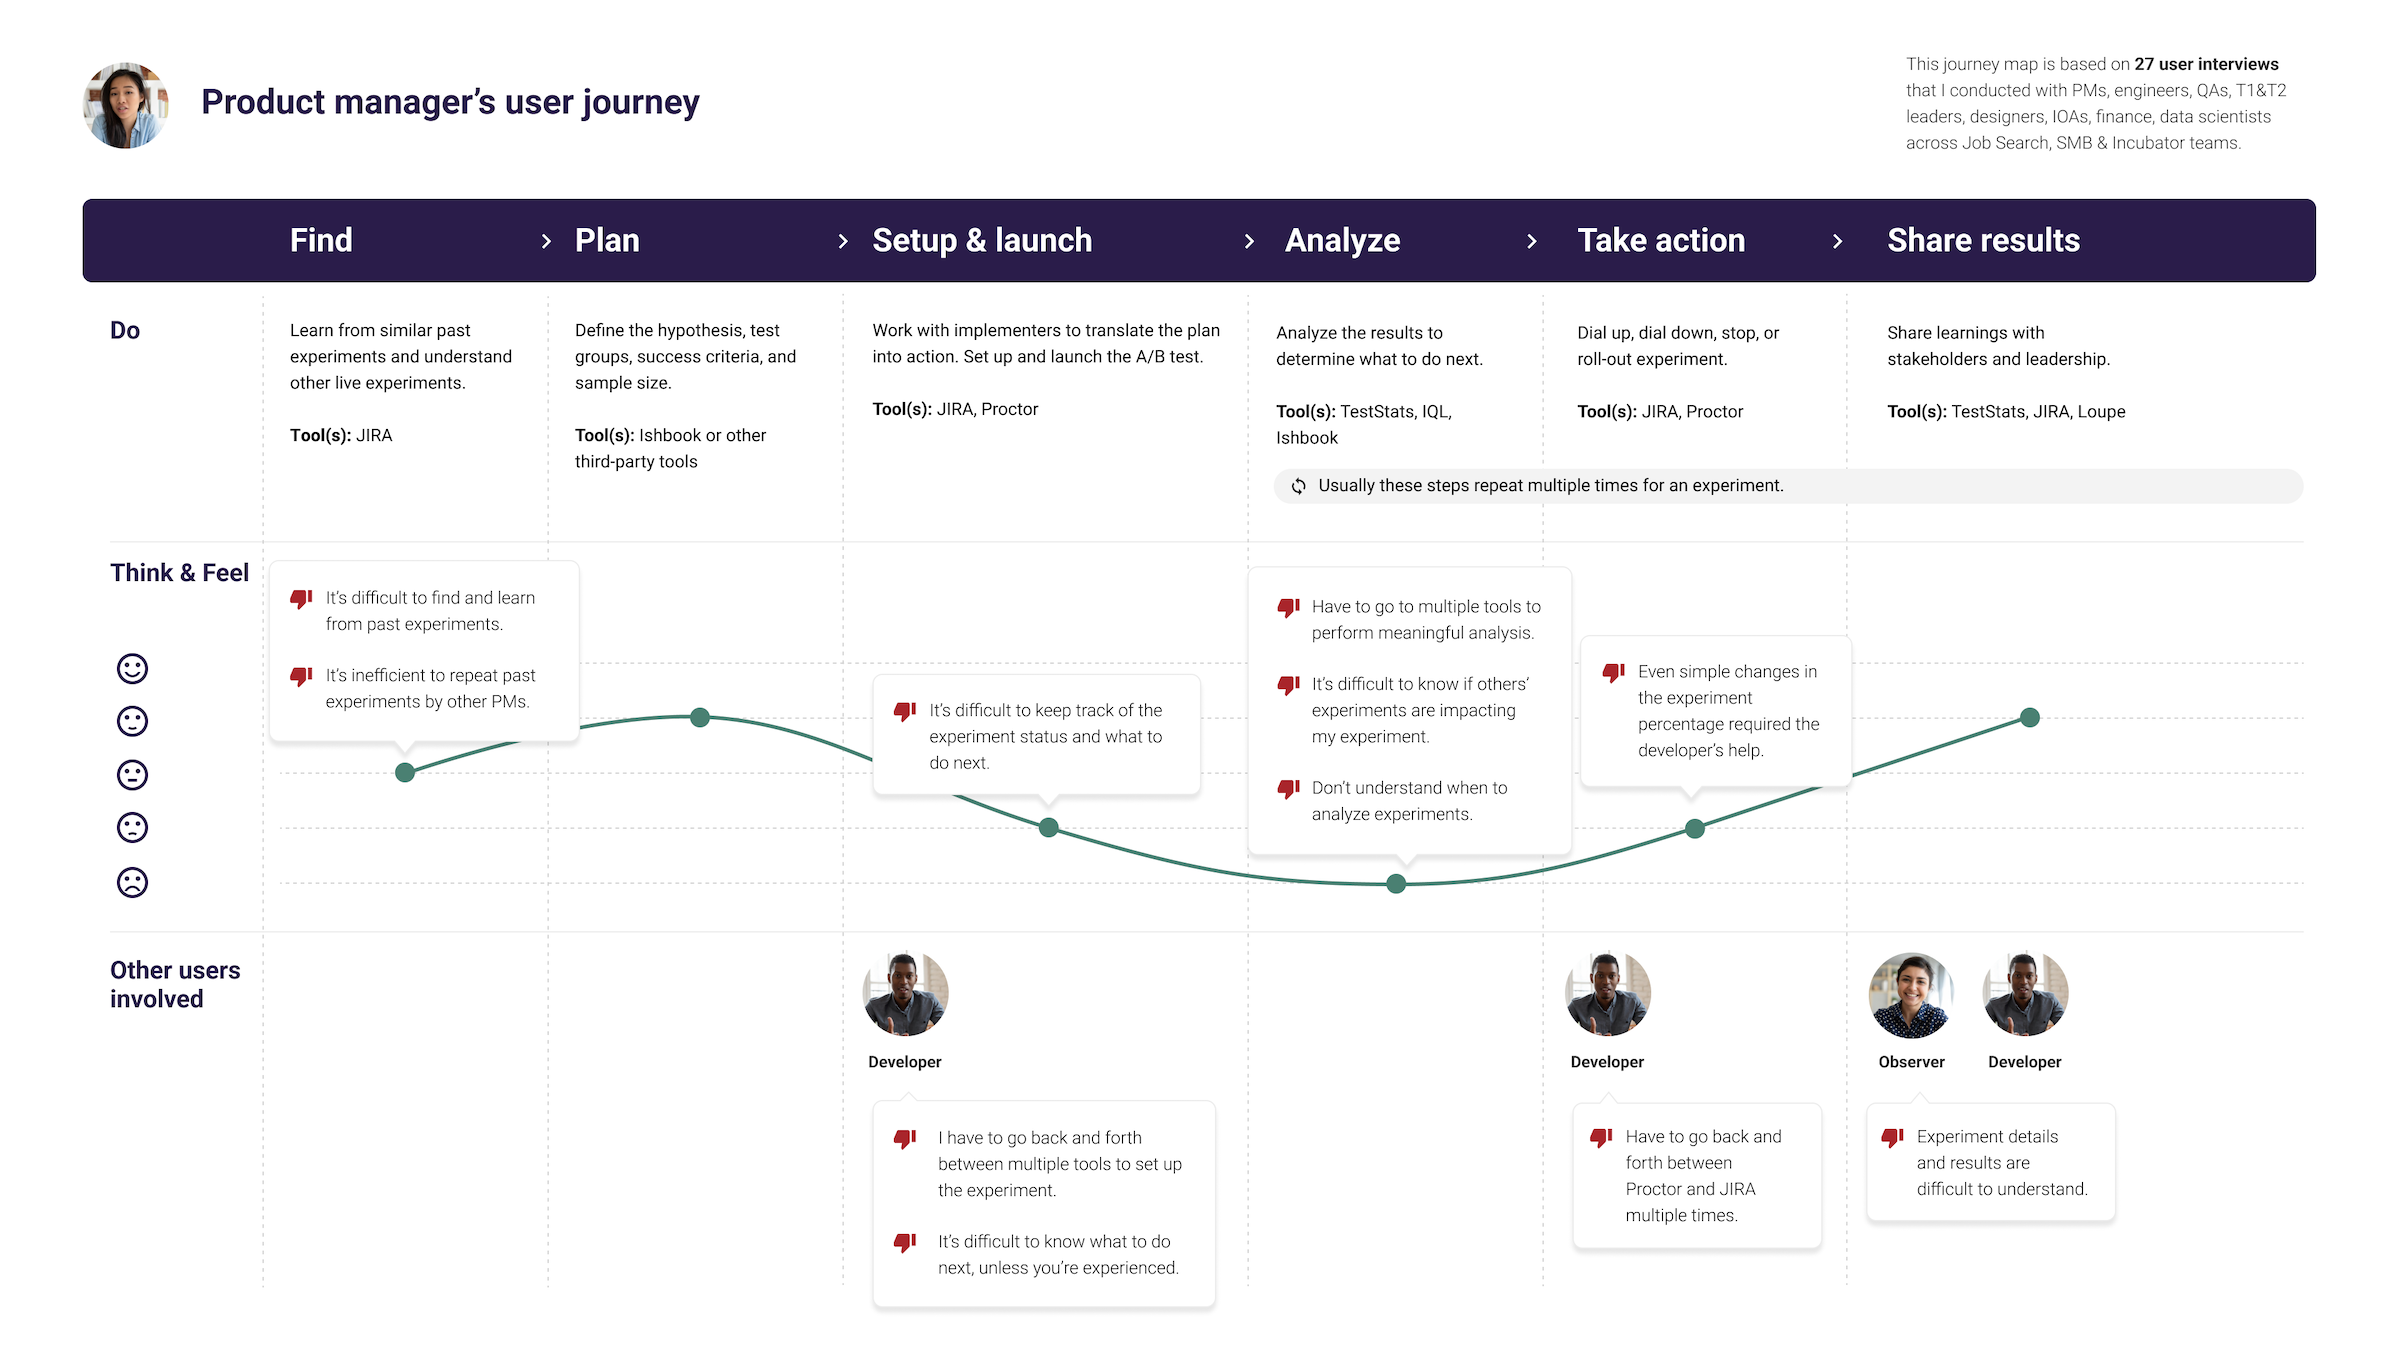
DISCOVERY RESEARCH WITH 27 USERS
No centralized A/B testing tools led to inefficiency.
01
PMs and observers can’t easily find and monitor experiments.
This caused PMs to repeat past experiments and to spend extra time answering questions from other teams about their experiments.
02
PMs and developers waste time going to multiple tools.
PMs also need to rely on developers to take simple actions on experiments after analysis.
03
PMs don’t always follow experiment best practices.
They may not define clear success criteria or waiting until they reach the sample size before making experiment decisions.
DESIGN SPRINT
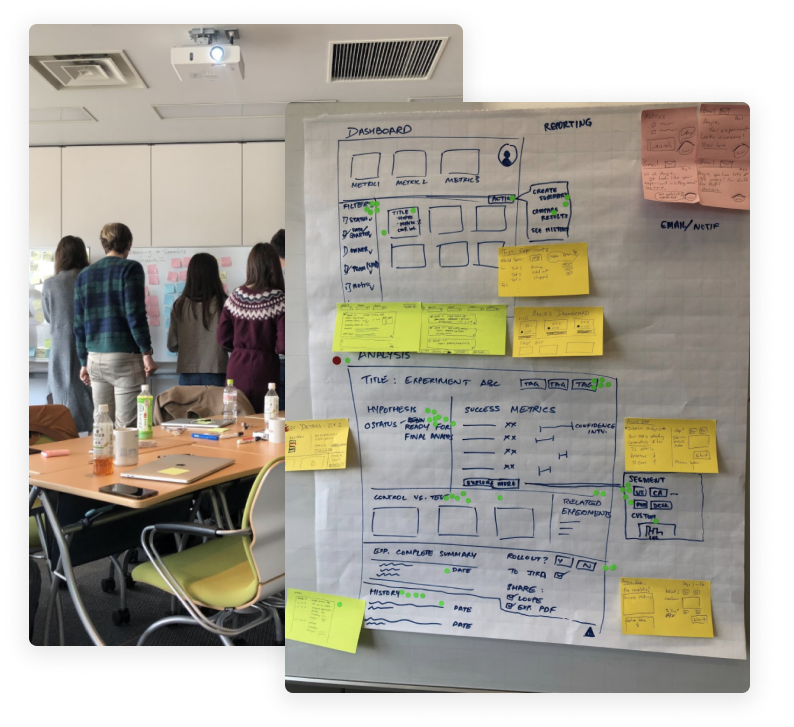
Creating one tool for finding, executing, and analyzing experiments.
5-days design sprint
Instead of making small UX improvements, I organized 2 Design Sprints with 15 people, bringing together PMs, a data scientist, and developers to define the product’s direction.
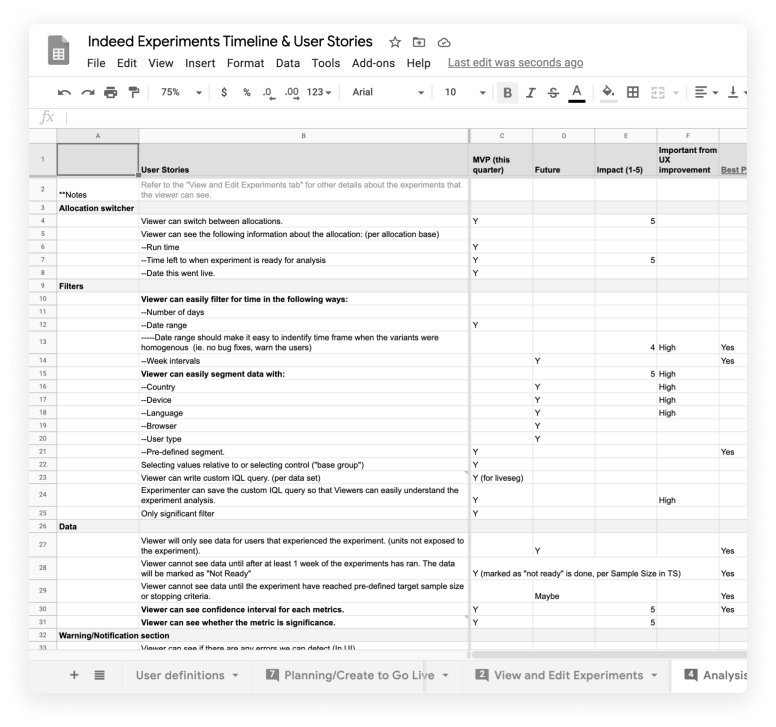
Post-sprint prioritization
After the design sprint, I listed out user stories that tested well in research and worked with the PM and development lead to determine priorities based on impact and effort.
USER JOURNEY PART 01
Find experiments

USE CASES & EXPLORATIONS
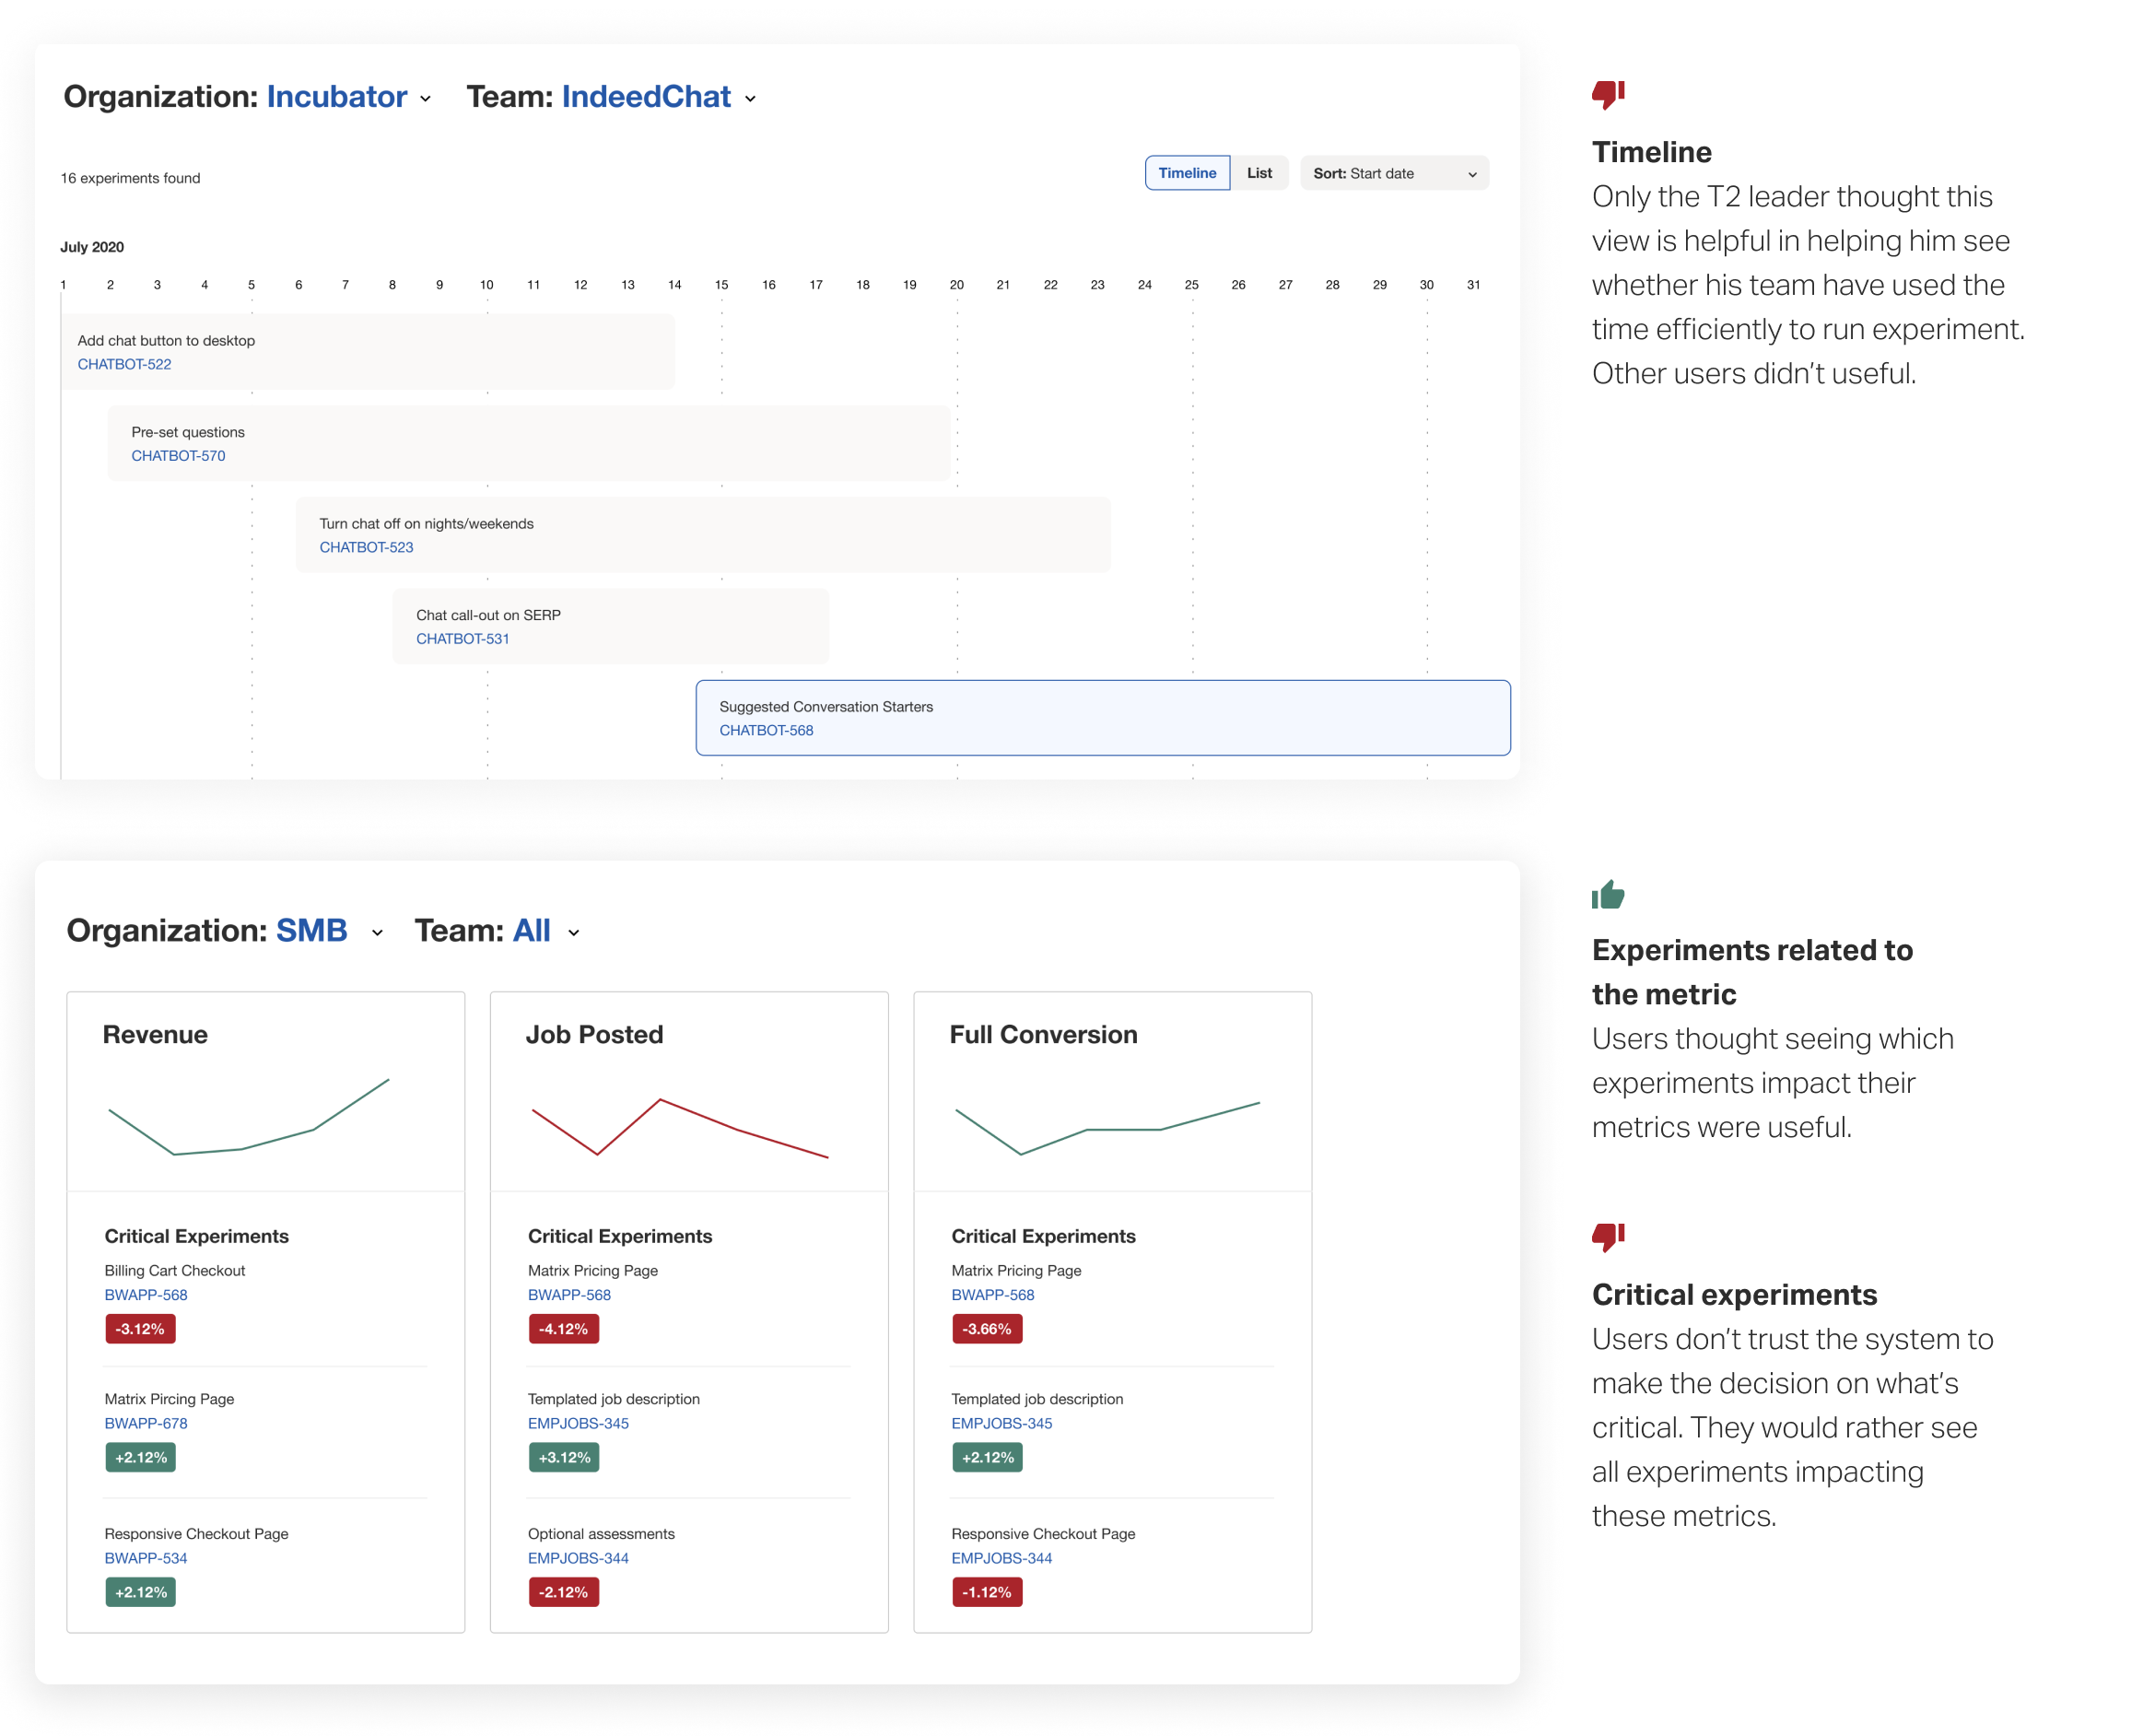
Exploring ways to help users find and monitor experiments.
Product manager — Learn from past experiments before running an experiment.
T1/T2 leadership — Know what experiments are launching, when, and why.
Country lead, Finance analyst, PM — Know which experiments are impacting their metrics.
FINAL DESIGN
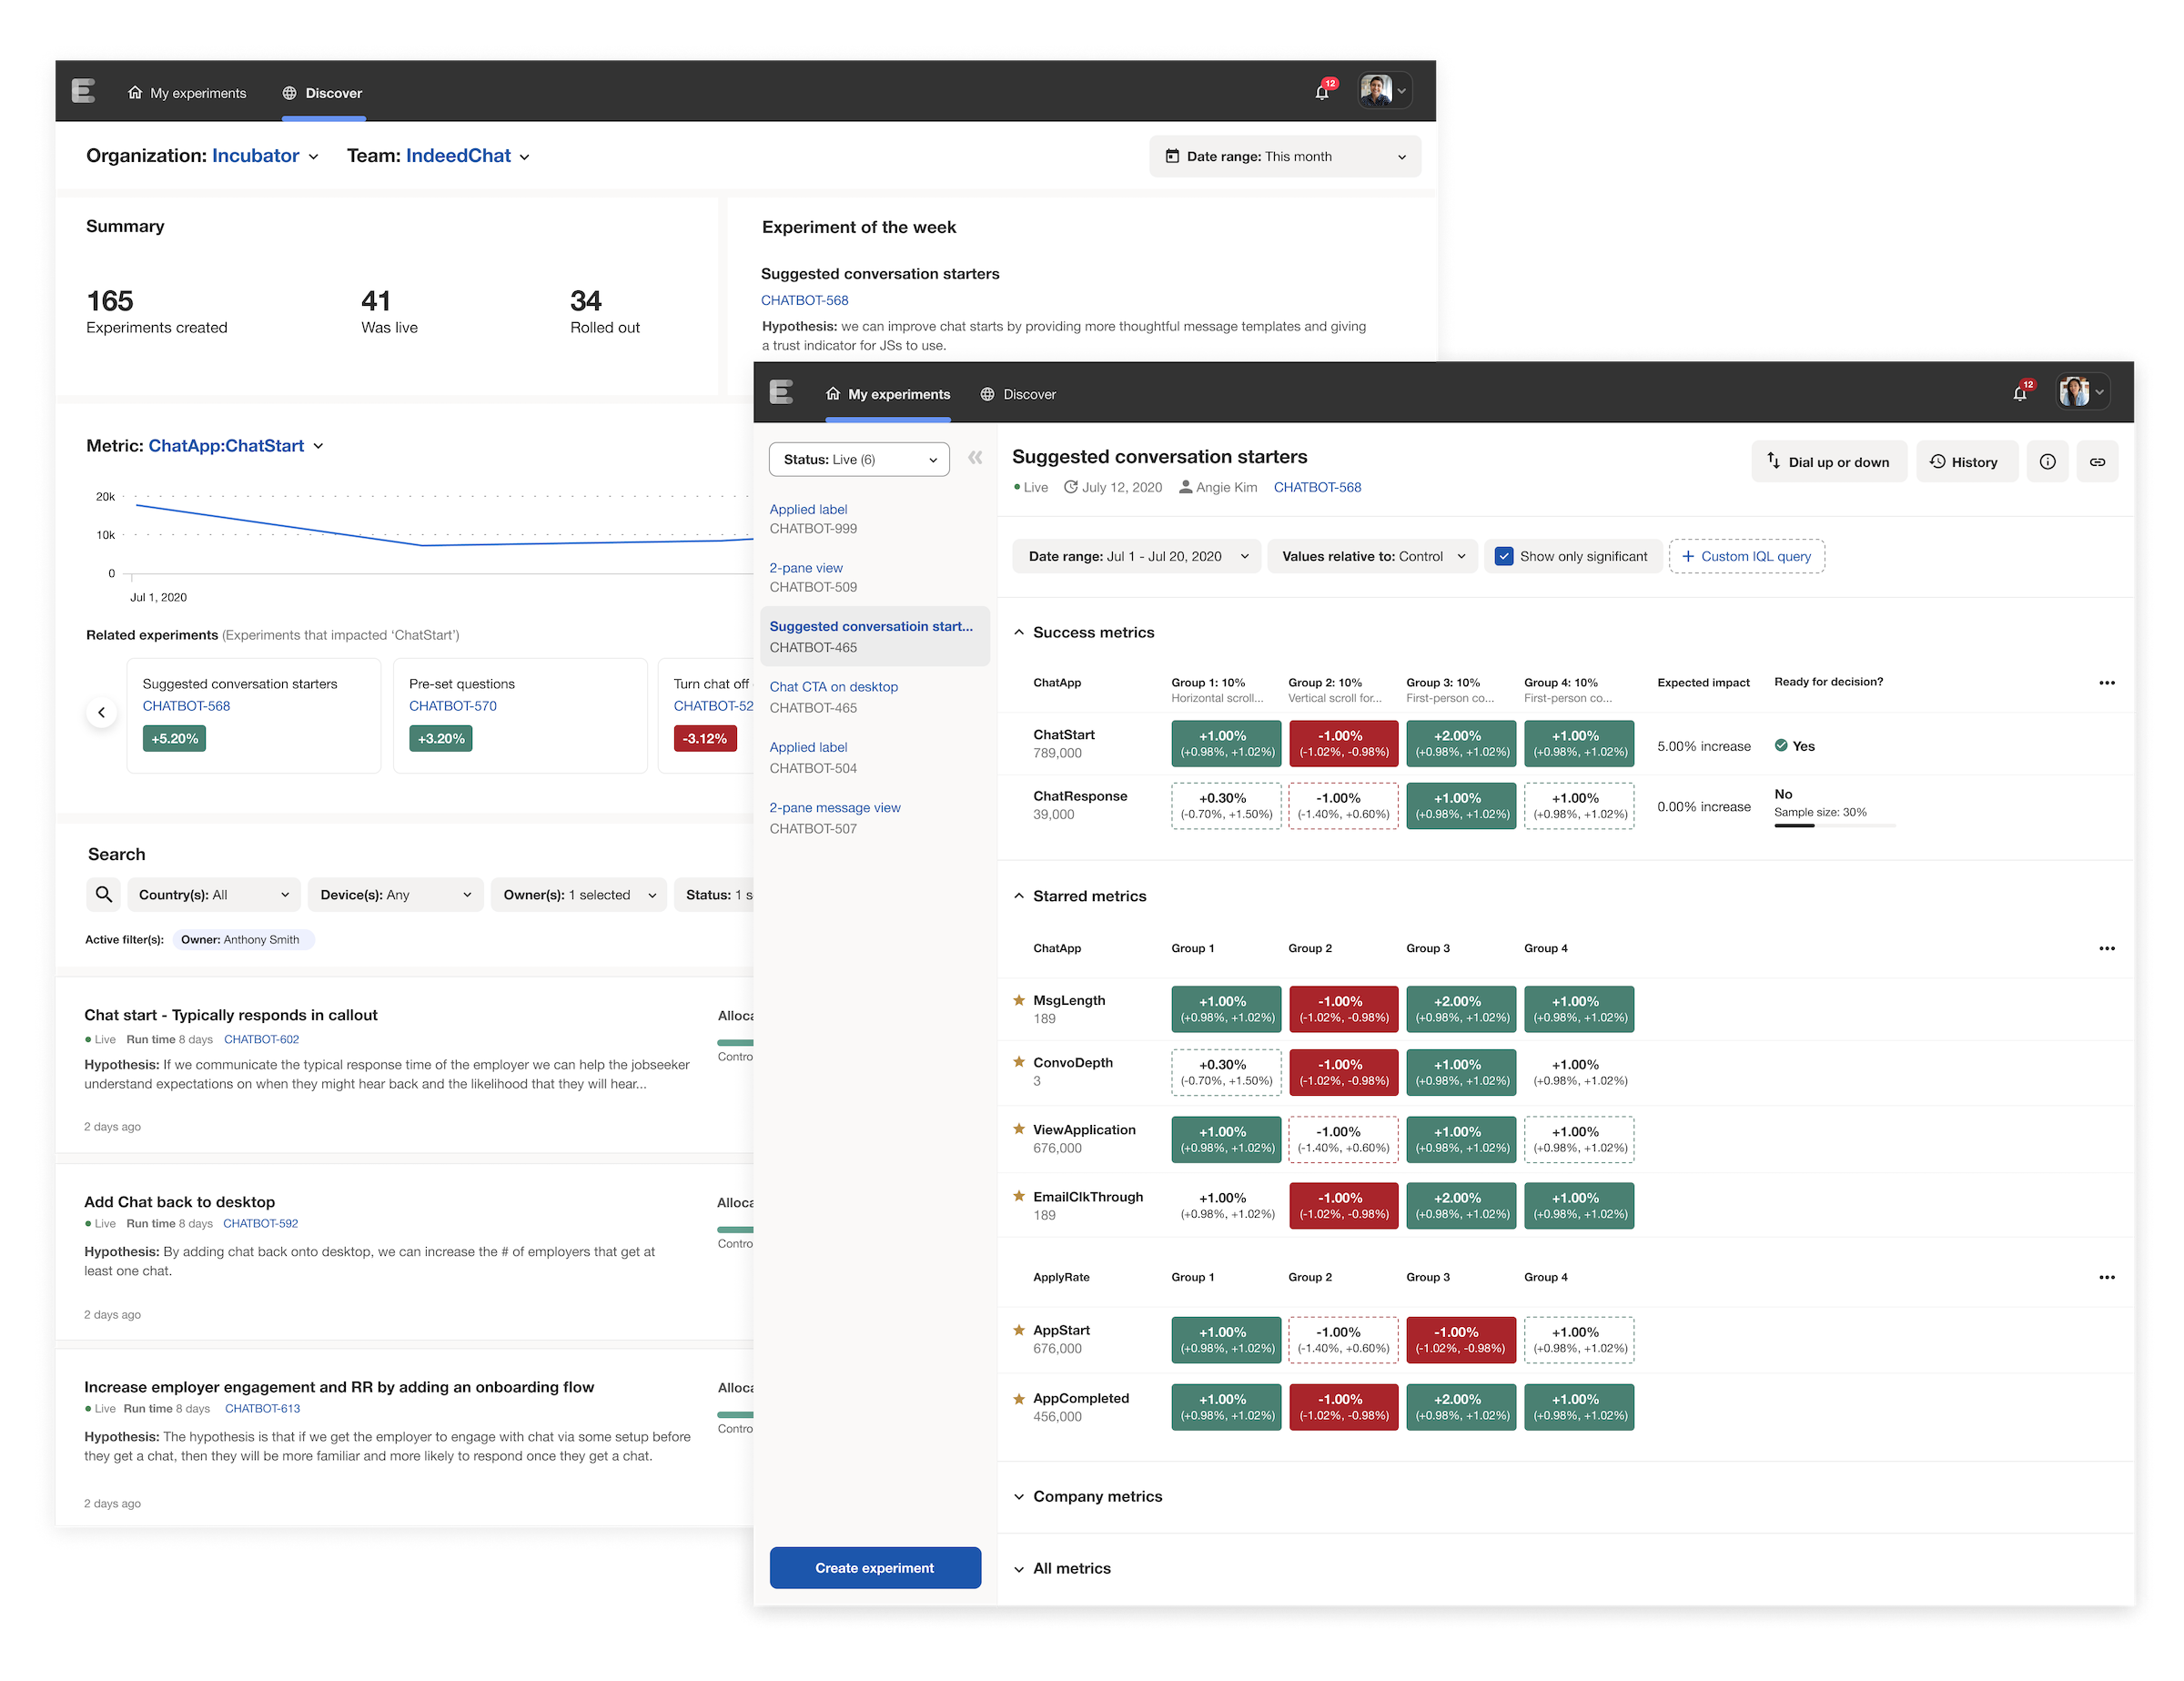
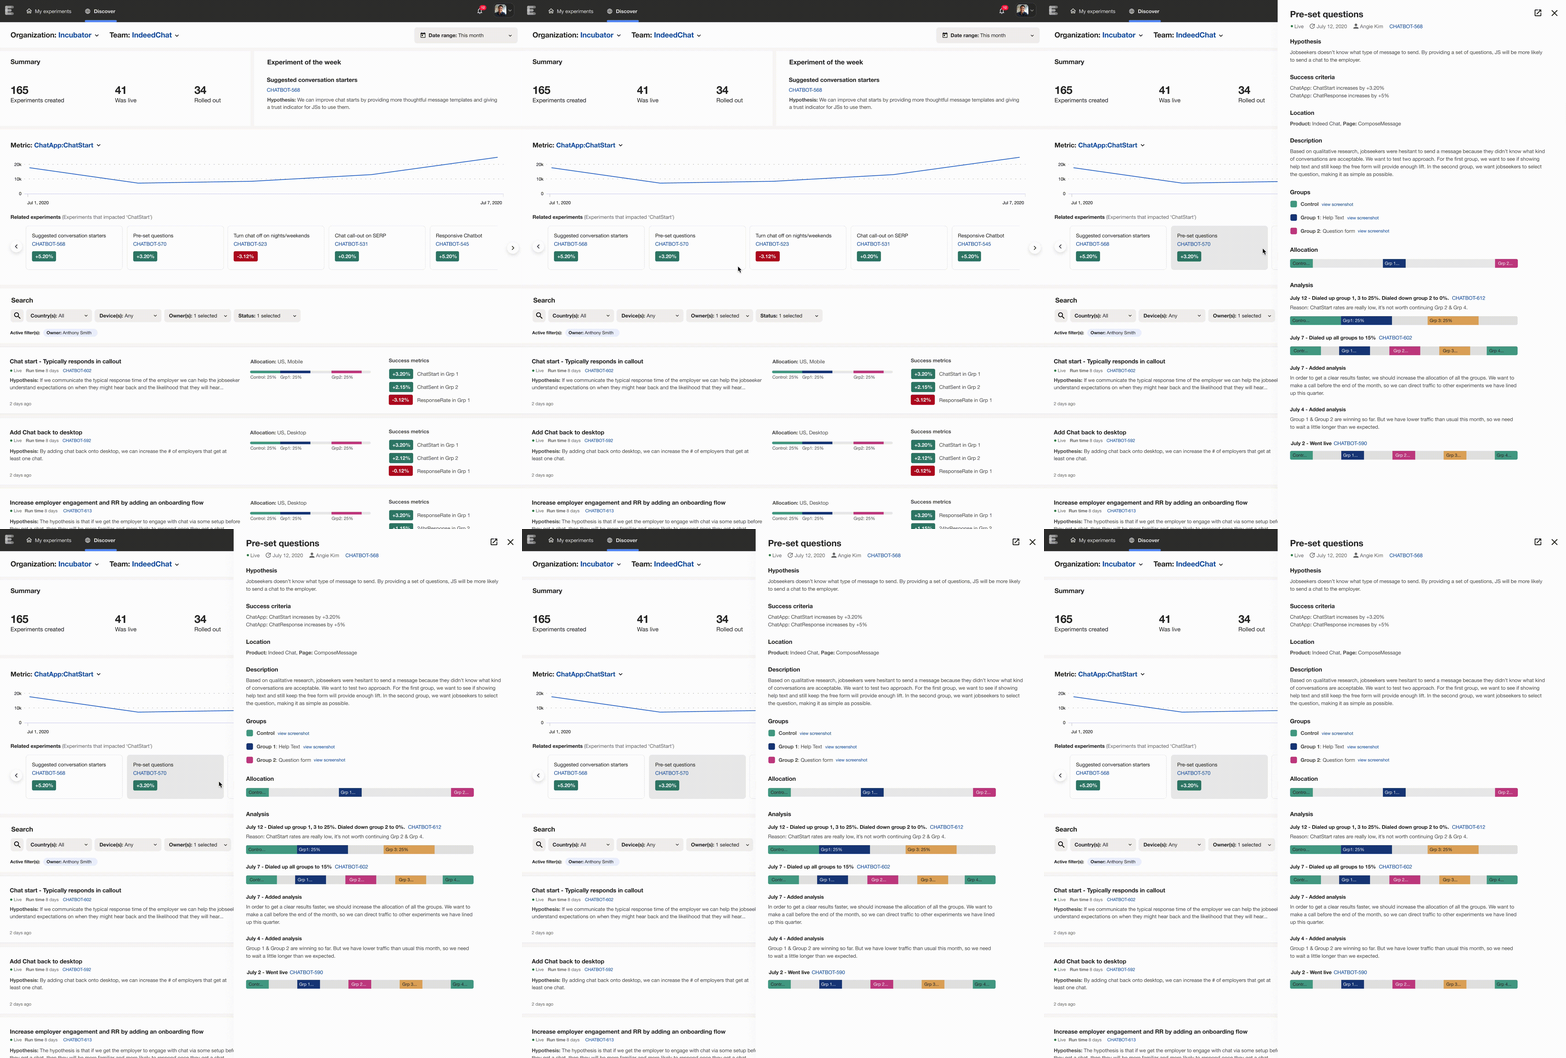
22.26% of product managers use search at least once per week.
The search feature was launched as an MVP because it covers the most use cases. We also proved that Indeedians wants to find experiments ran by others because 50.46% of users browsed experiments they didn’t own.
USER JOURNEY PART 02
Plan, setup, and launch

WORKFLOW IMPROVEMENT
Simplifying the workflow to automate tedious actions.
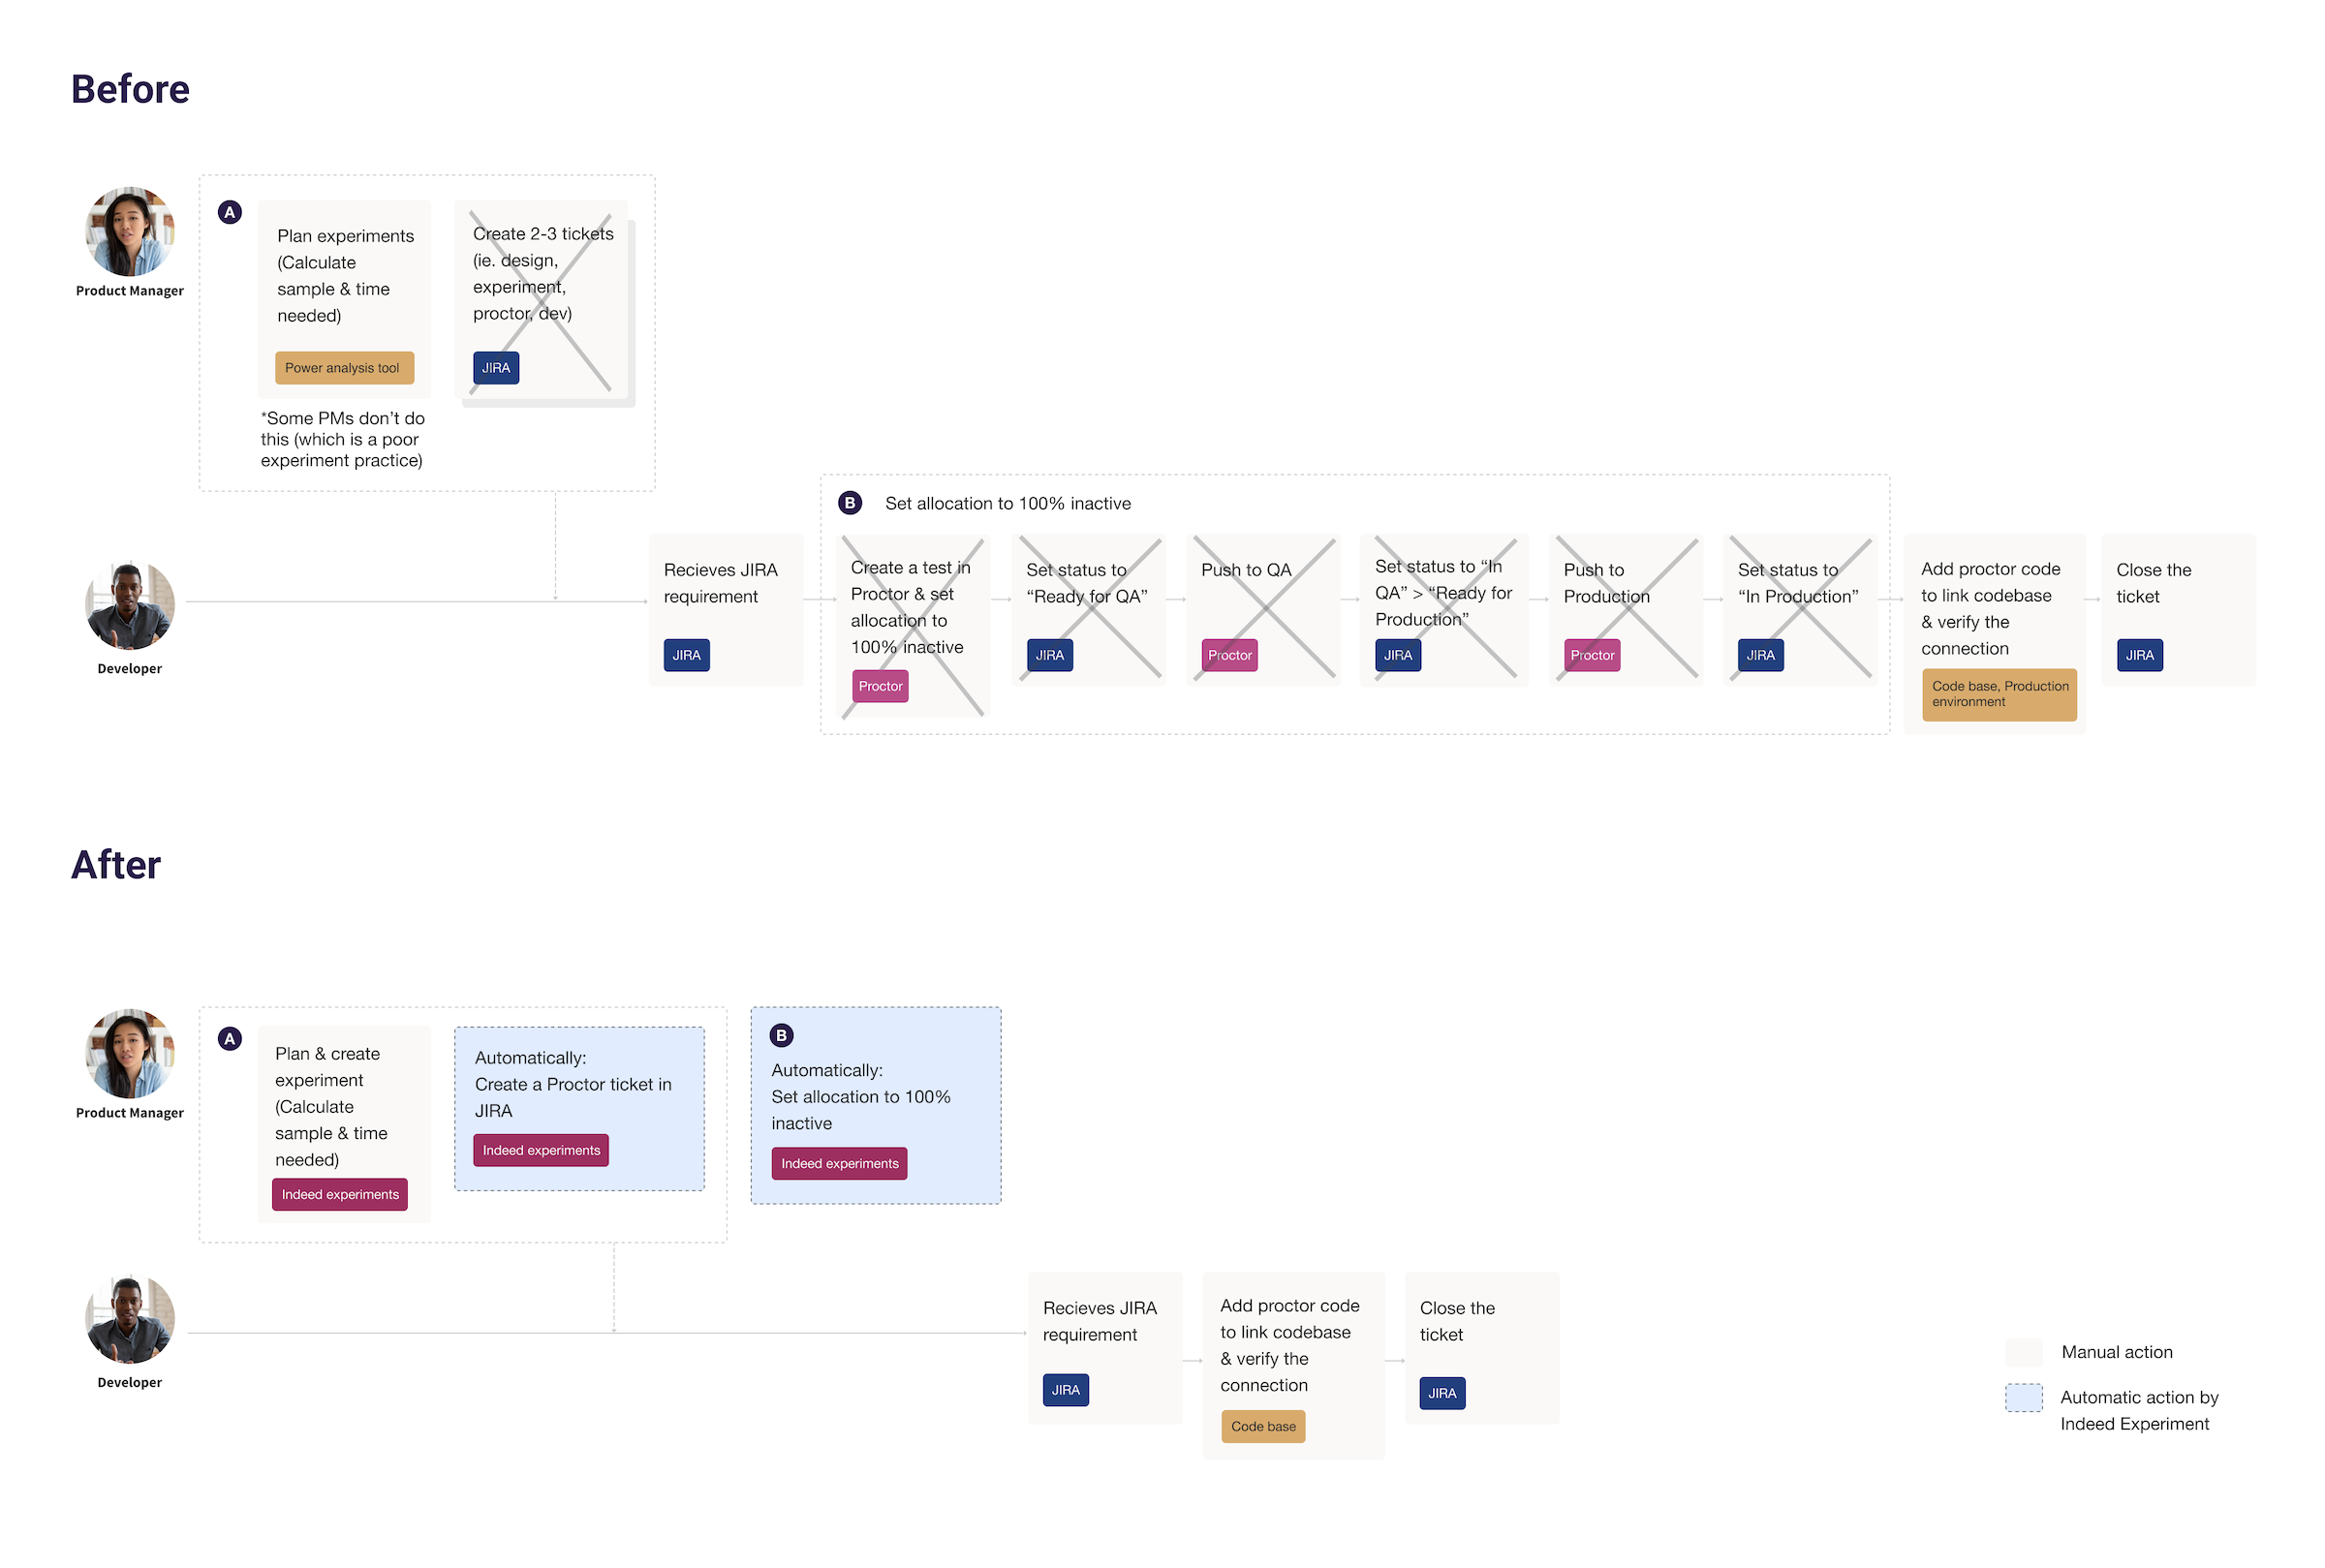
Problem: The biggest pain point was the need to go back and forth between Proctor and JIRA.
Solution: Auto-create JIRA tickets and auto-sync the status to keep users within the same tool.
DESIGN IMPROVEMENT
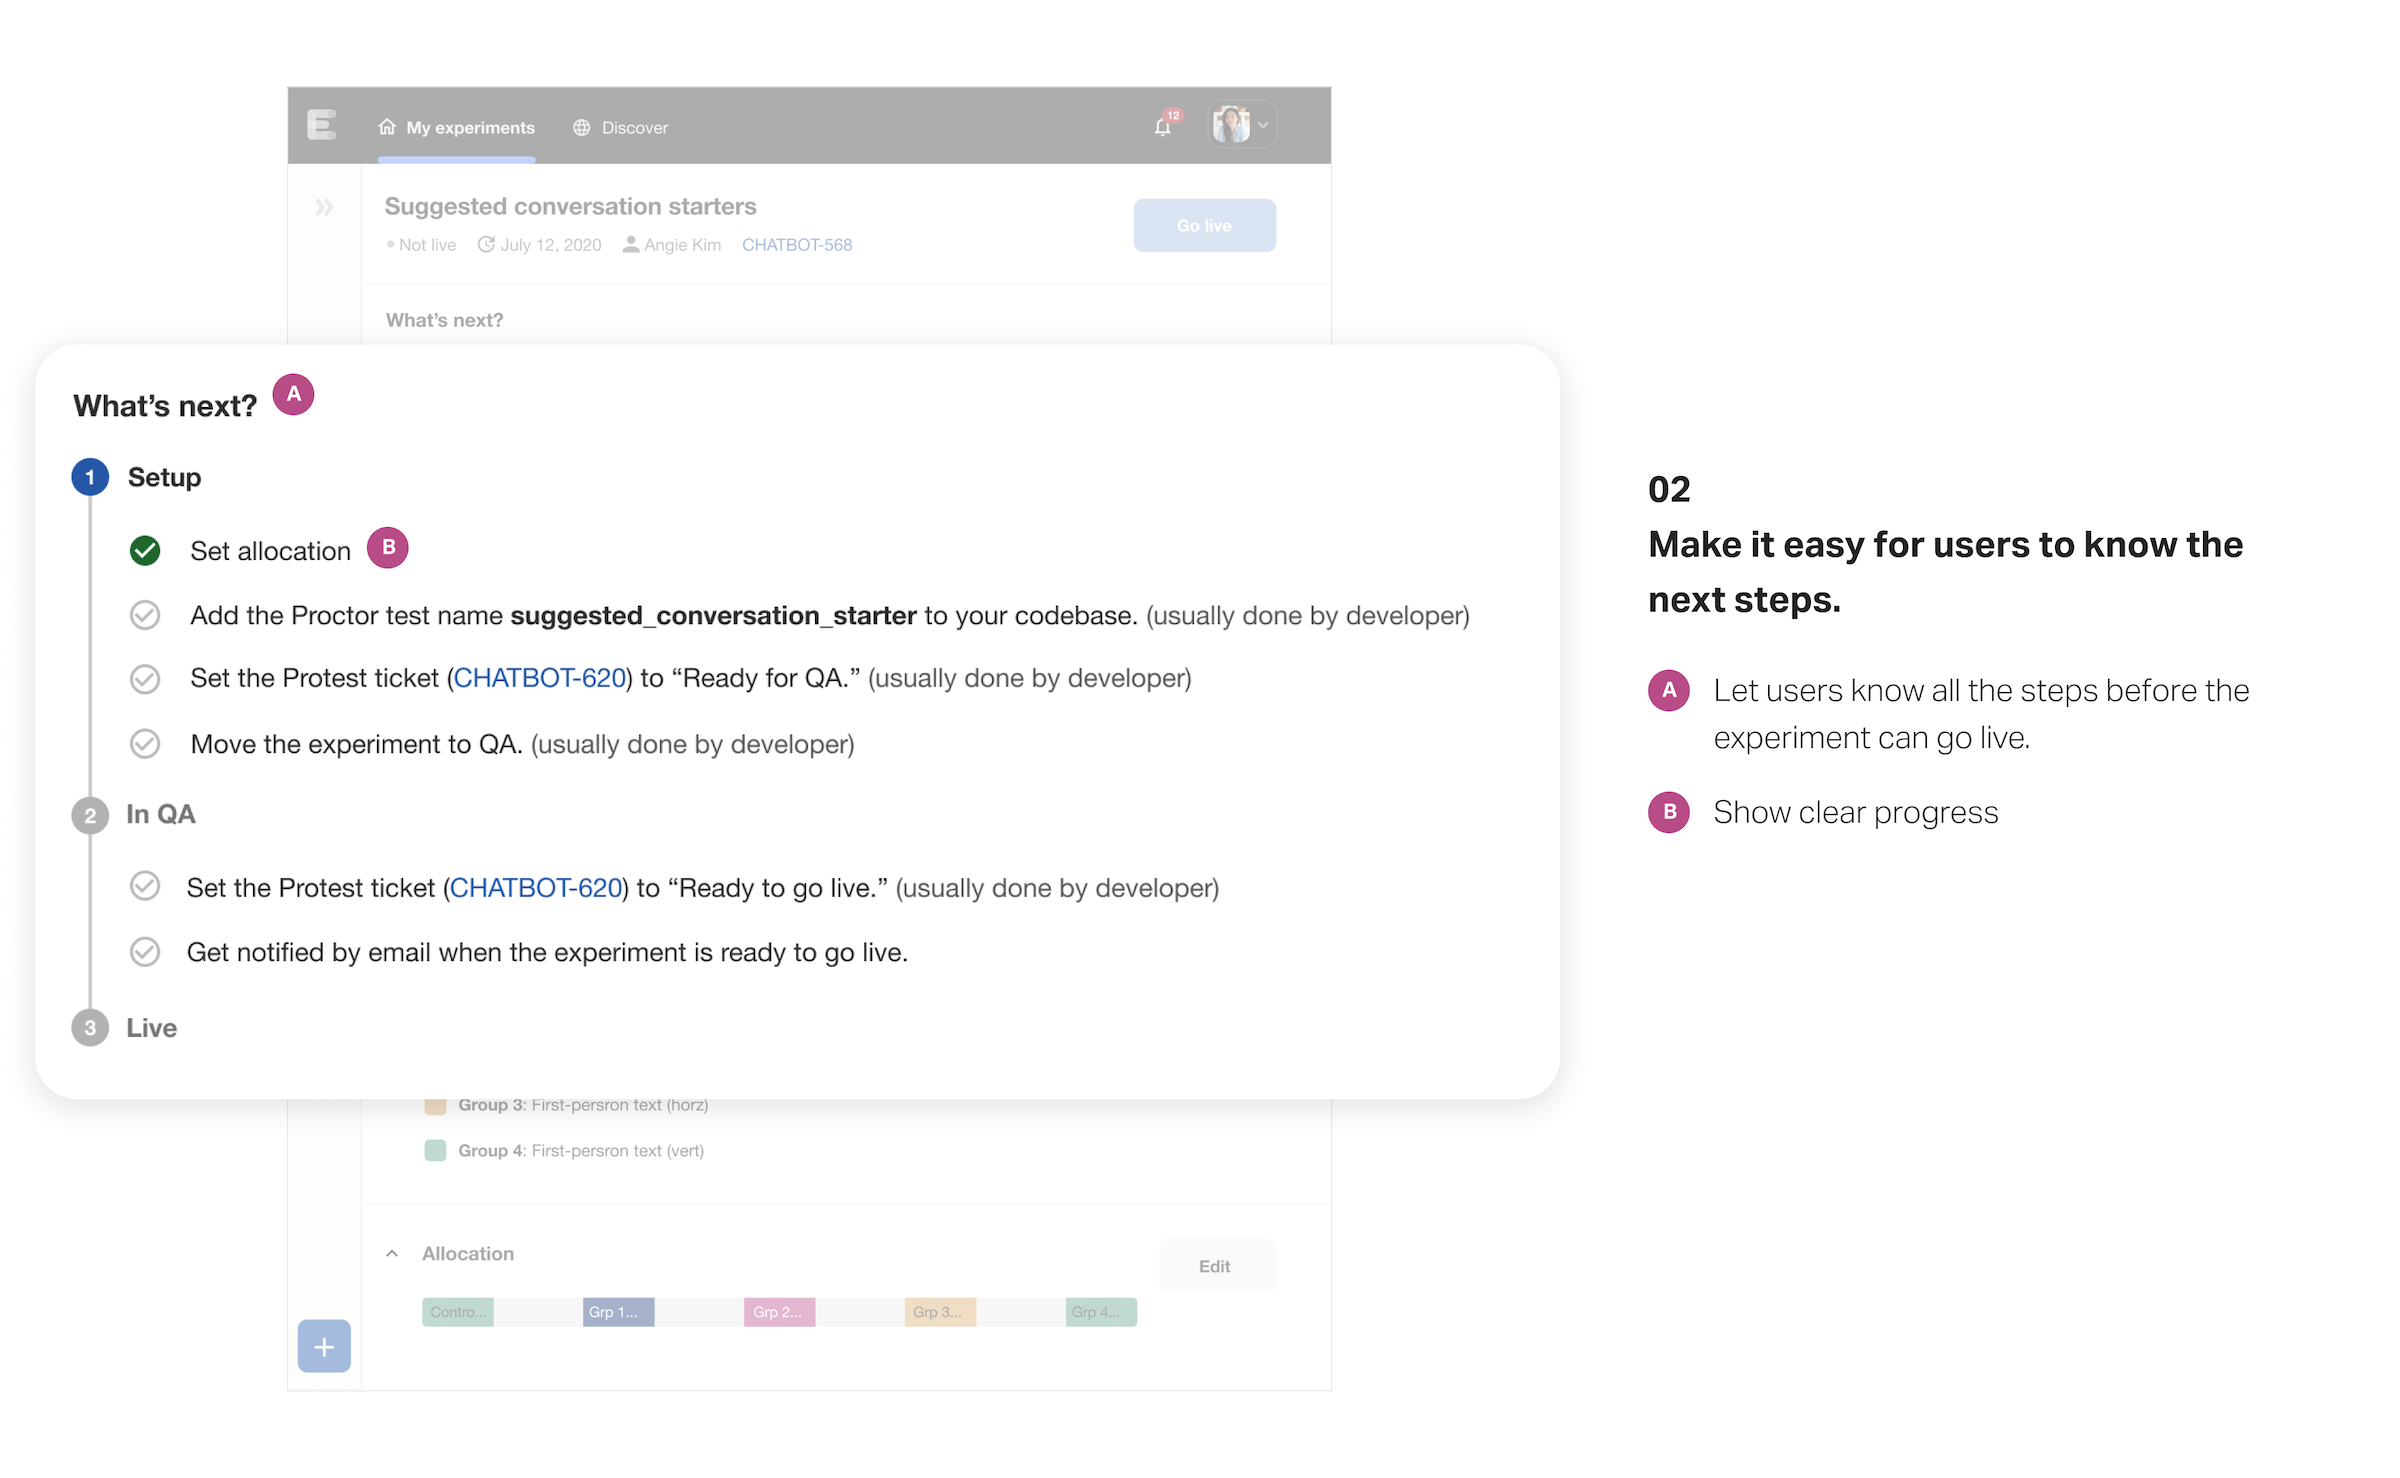
Provide guidance to adopt best practices and clear next steps.
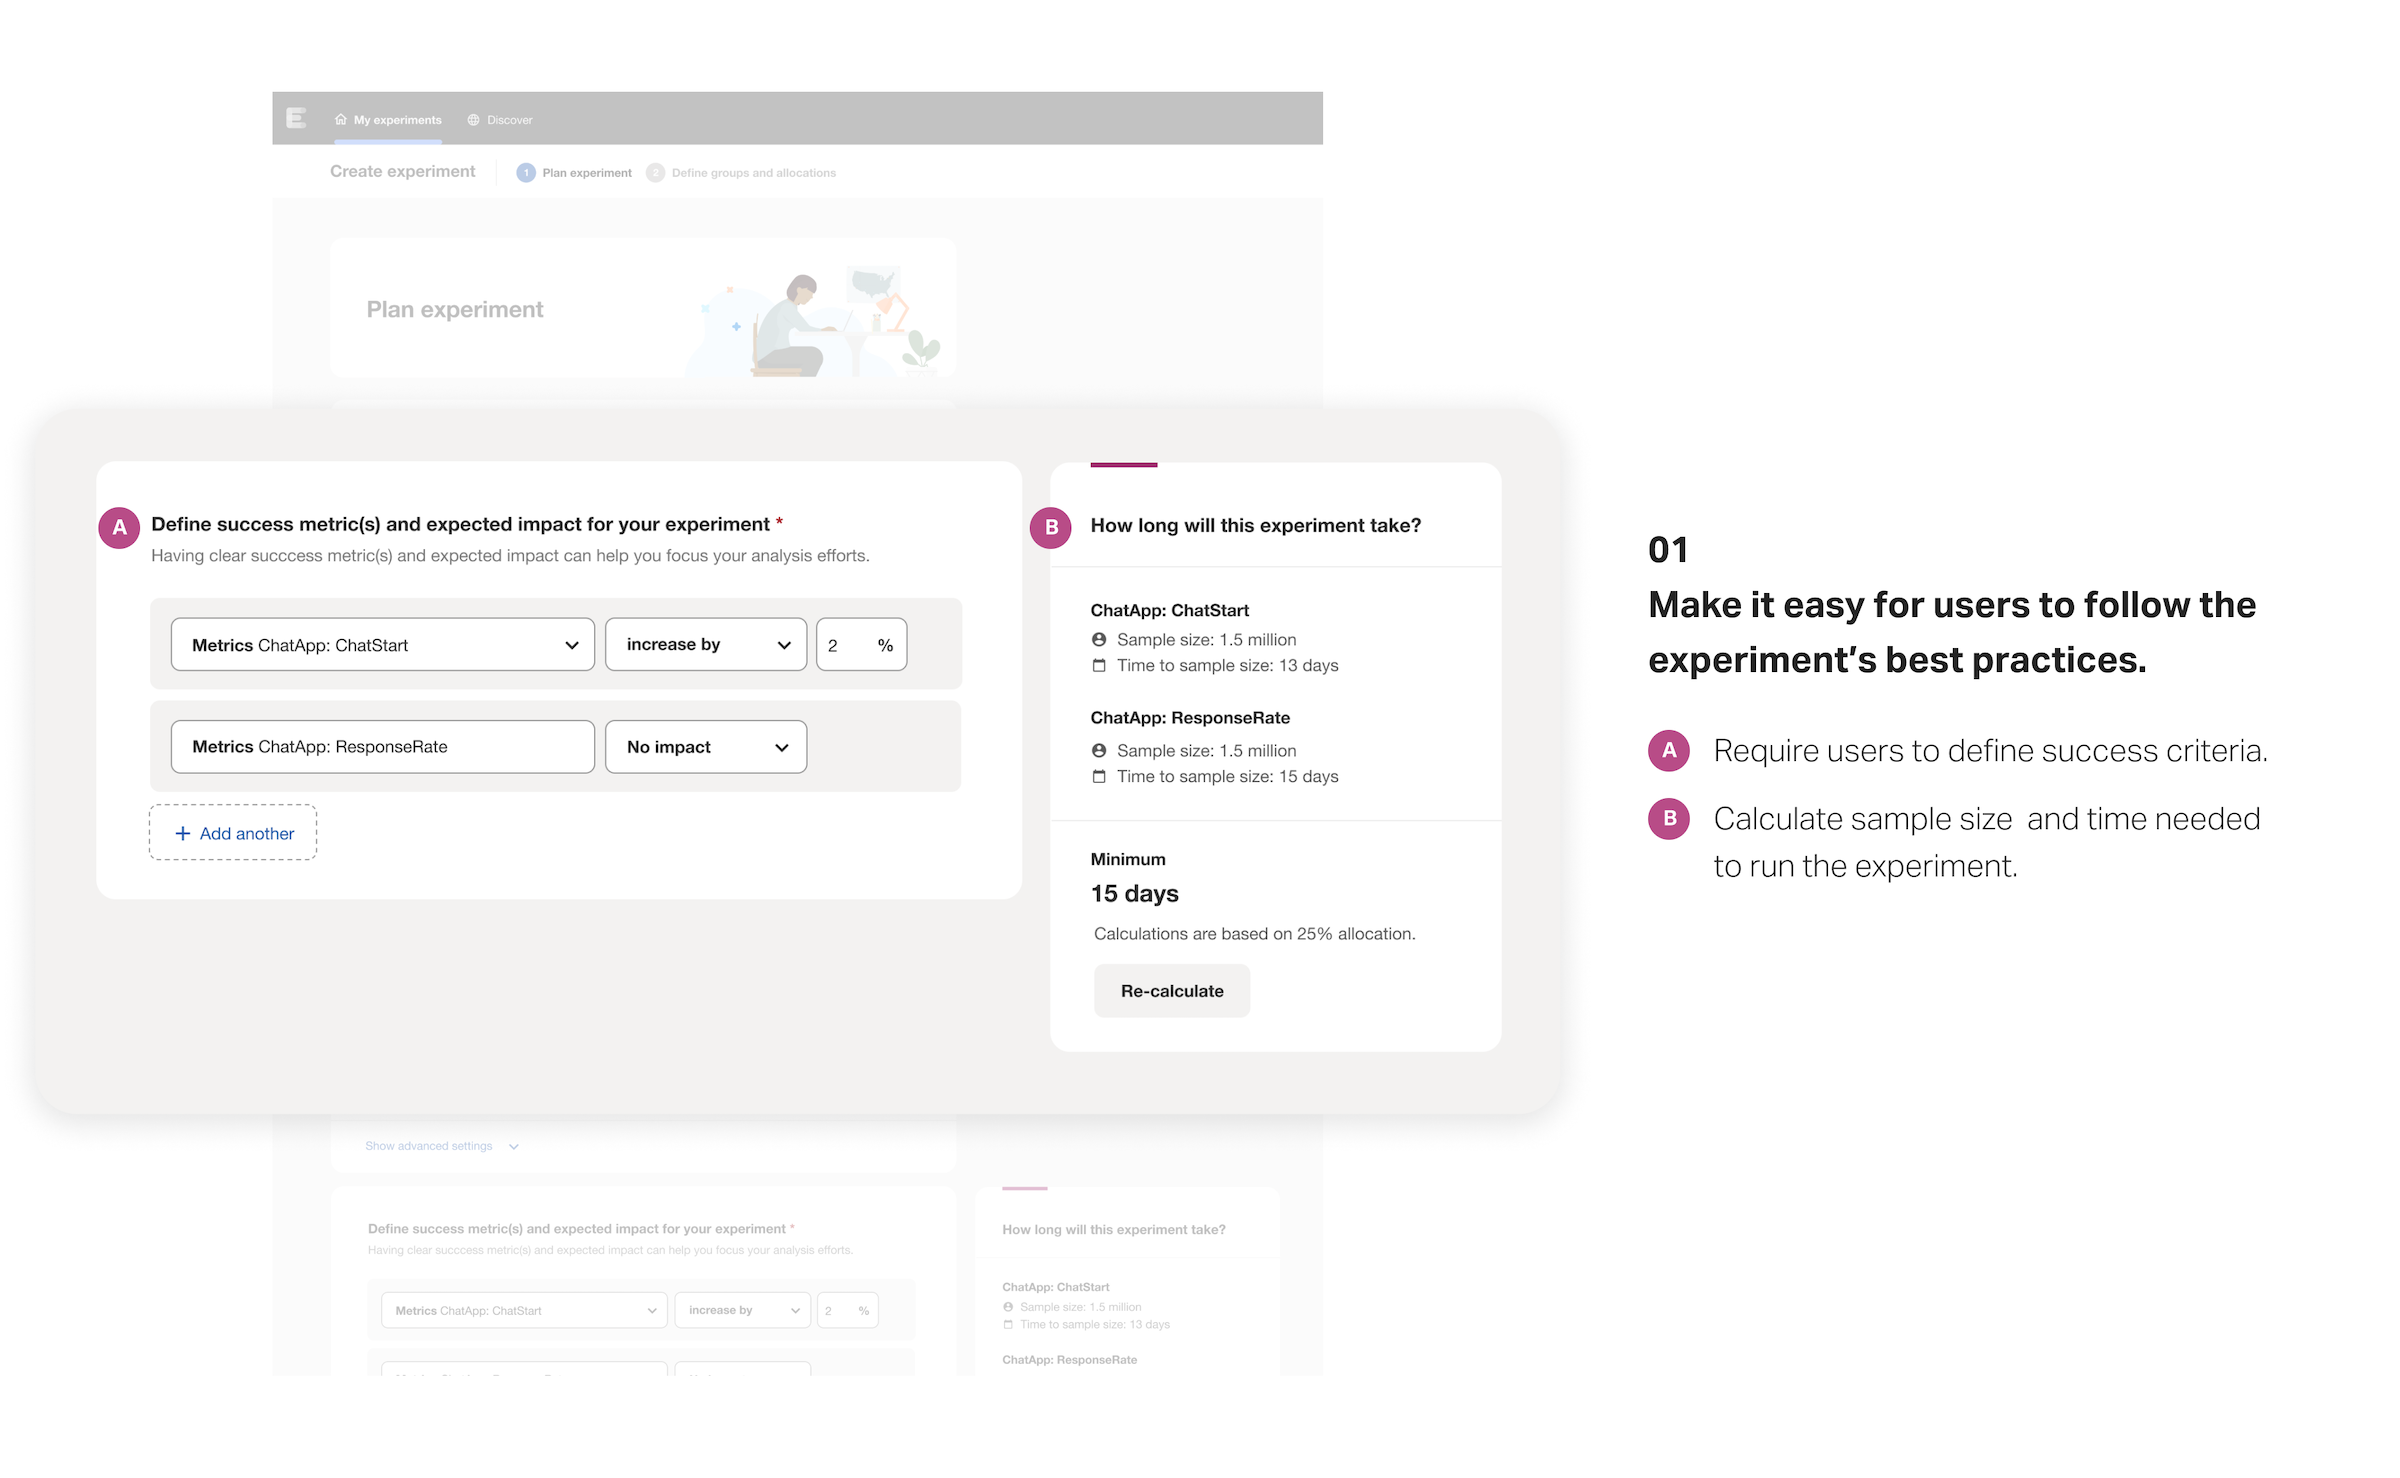
Problem: The experiment setup process and best practices are difficult to learn.
Solution: Make it easy for users to follow the experiment’s best practices and show the next steps in the tool.
VISUAL DETAIL
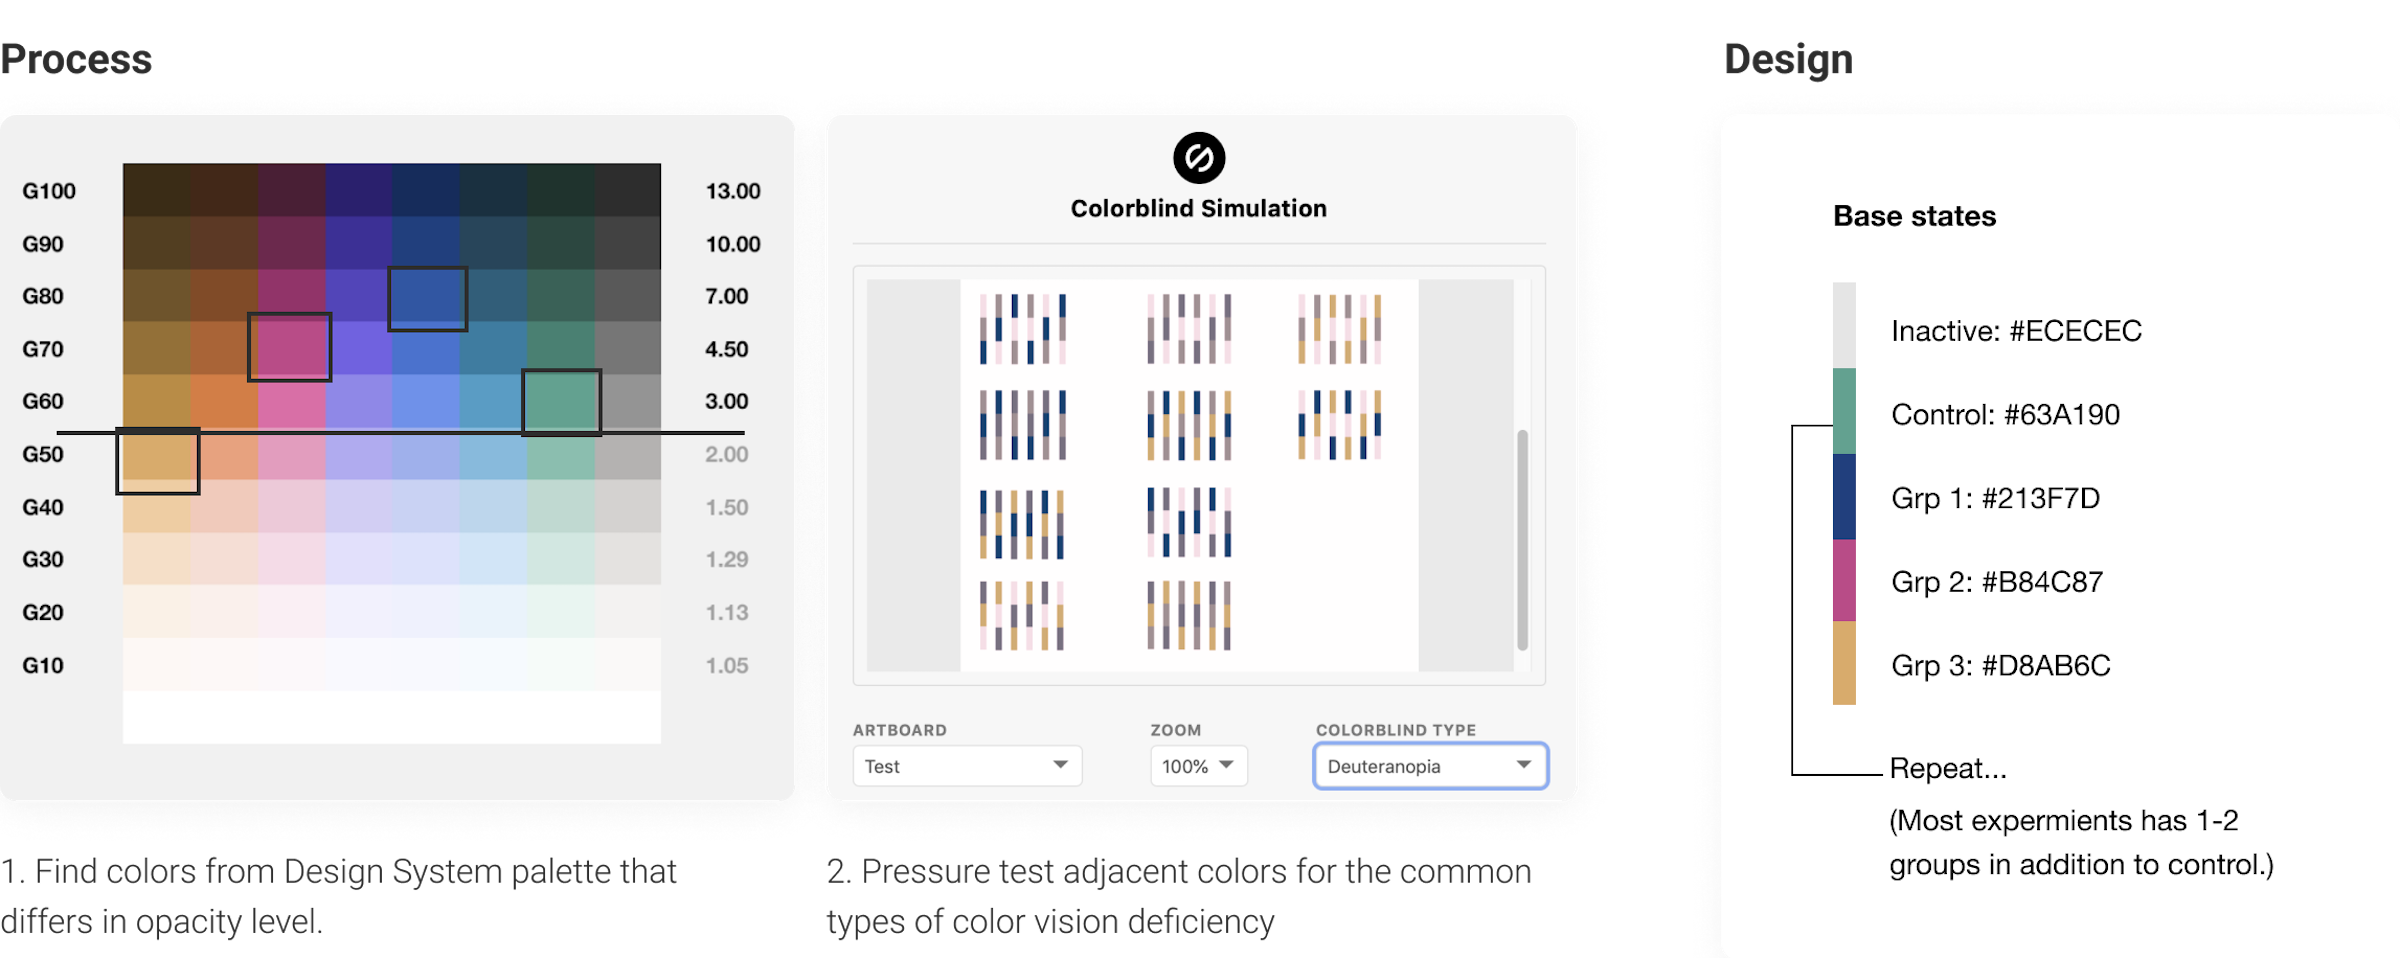
Ensure the allocation bar design is accessible.
Because it’s possible that the colors in the allocation bar will appear next to each other, I chose a set of colors from the Indeed Design System palette that pass the WCAG guideline for contrast when viewed side by side.
USER JOURNEY PART 03
Analyze, take action and share

OVERALL IMPROVEMENT
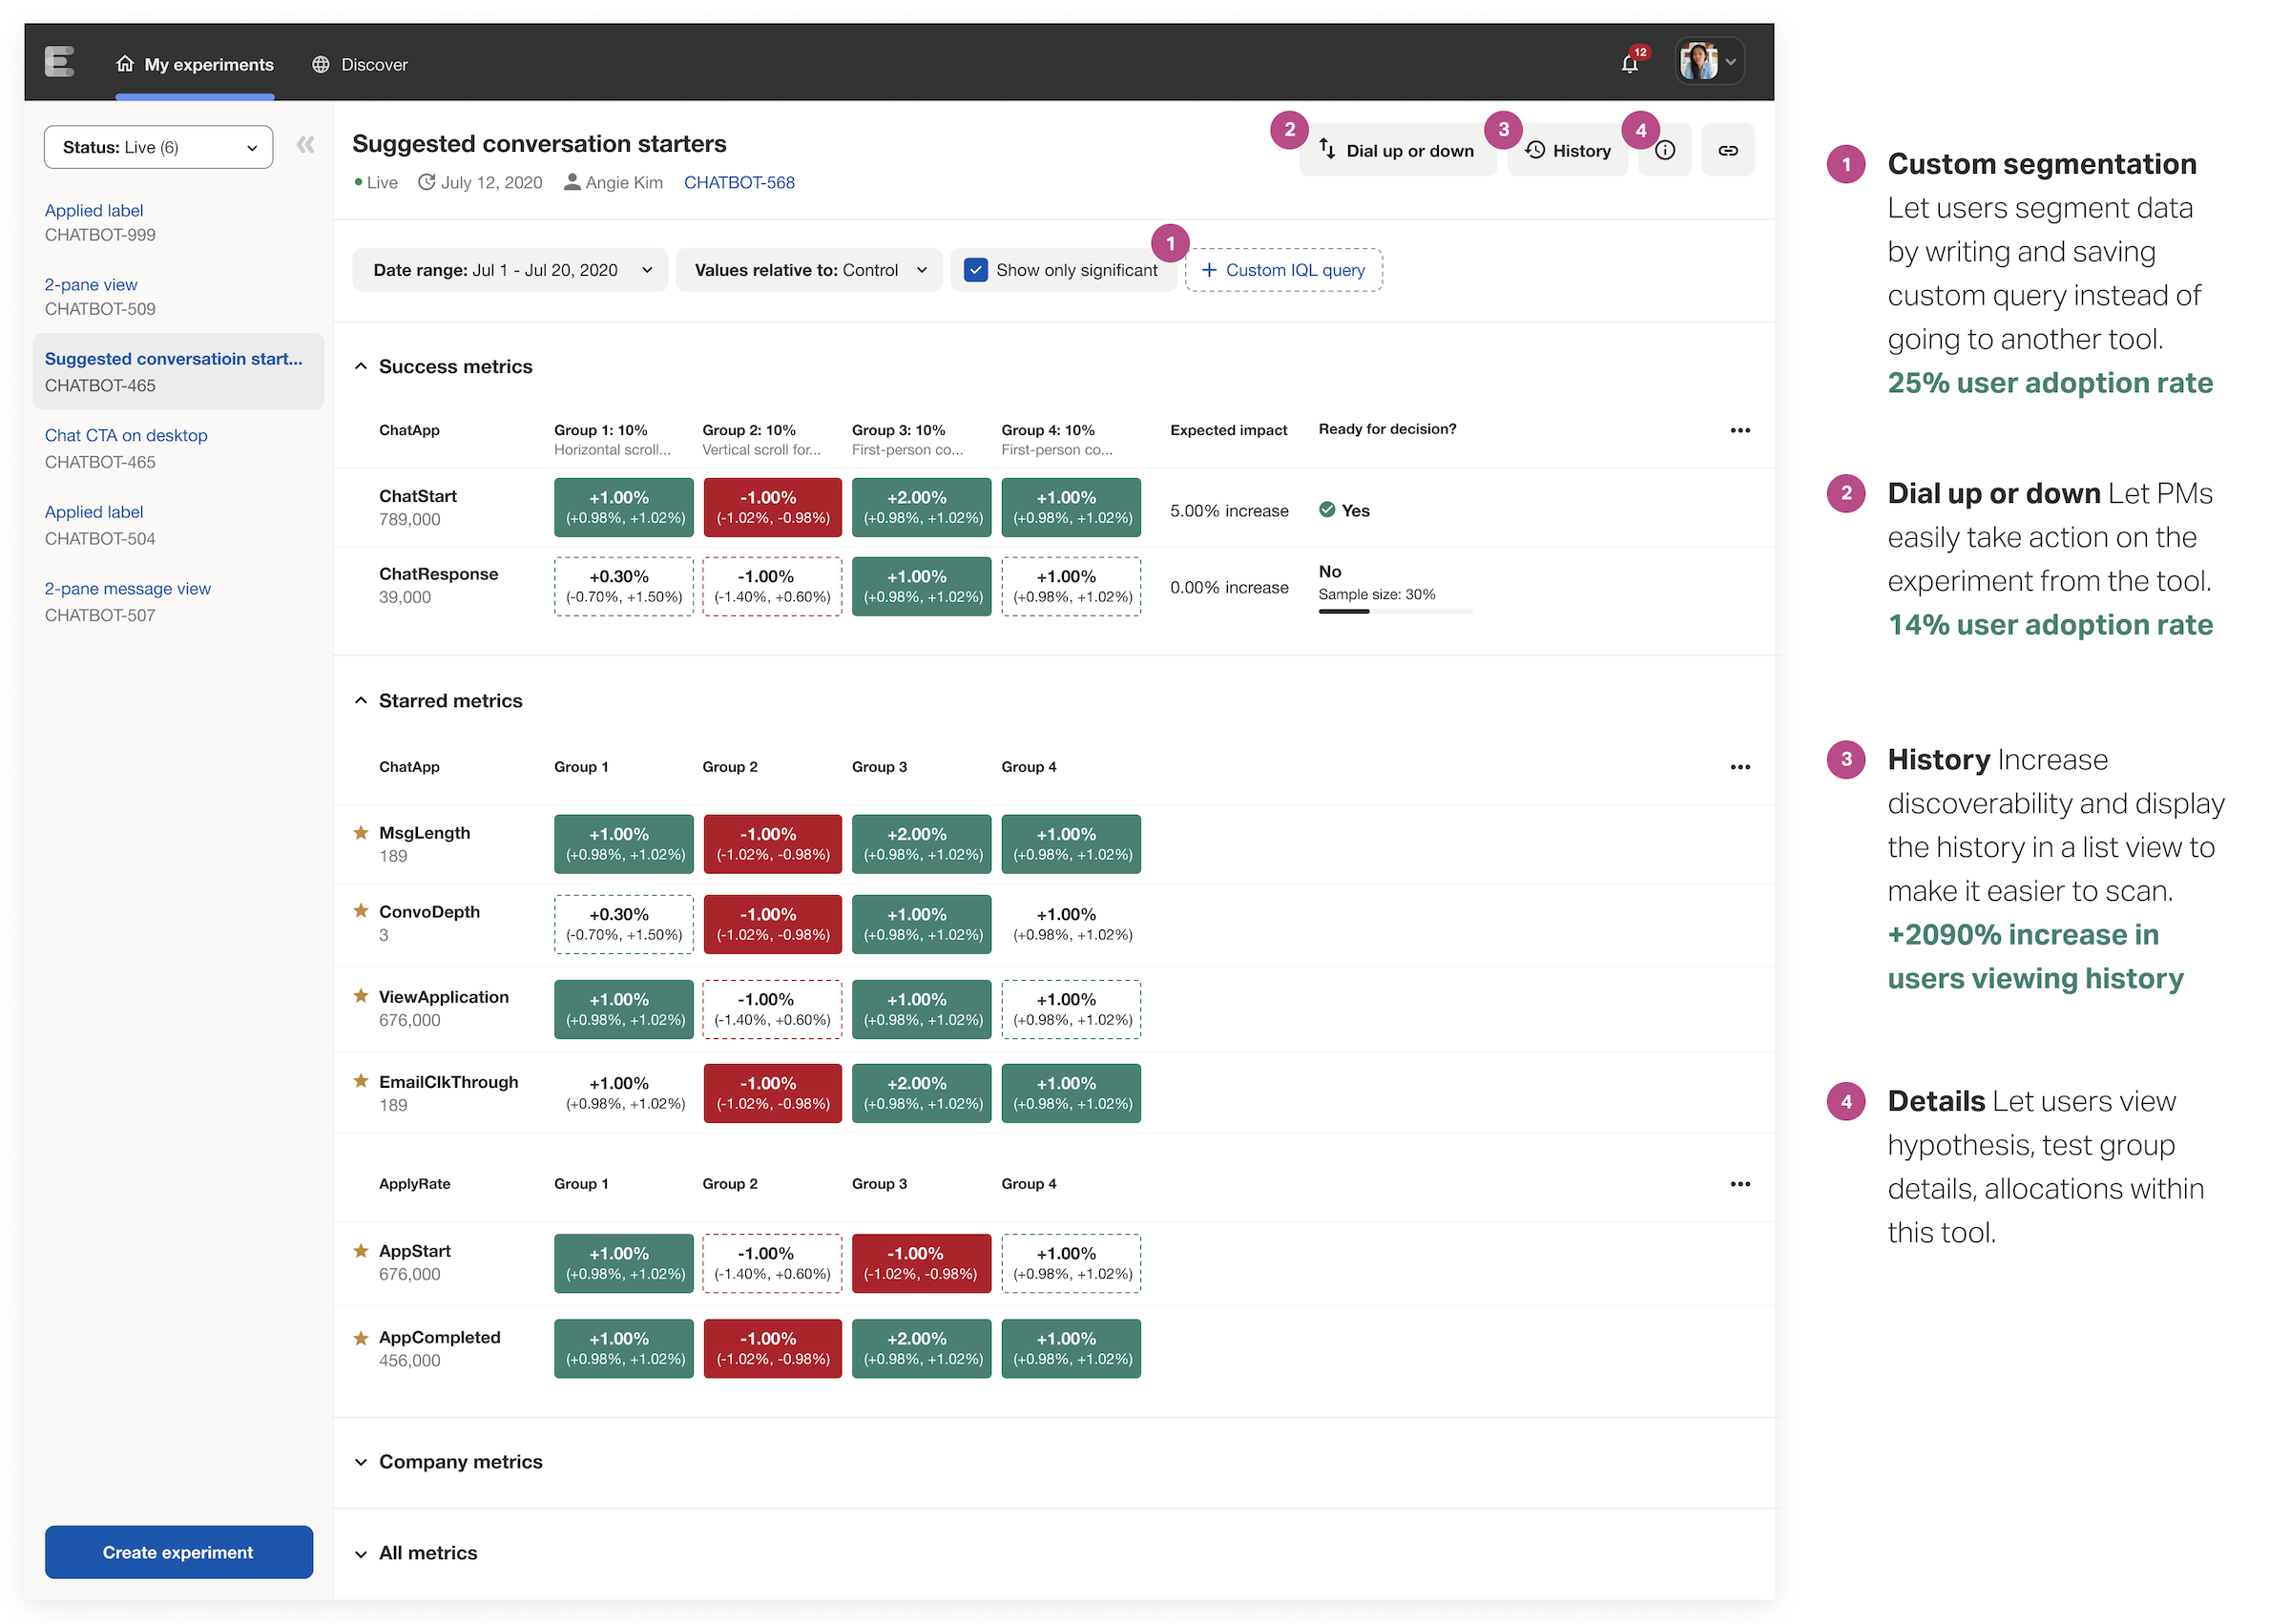
Let PMs perform deeper analysis and take action on the experiments.
Problem PMs rely on multiple tools in this phase: IQL to segment data for further analysis; Proctor to view and change experiment allocation.
Solution Introduce new features to let PMs take these actions within this interface.
FEEDBACK
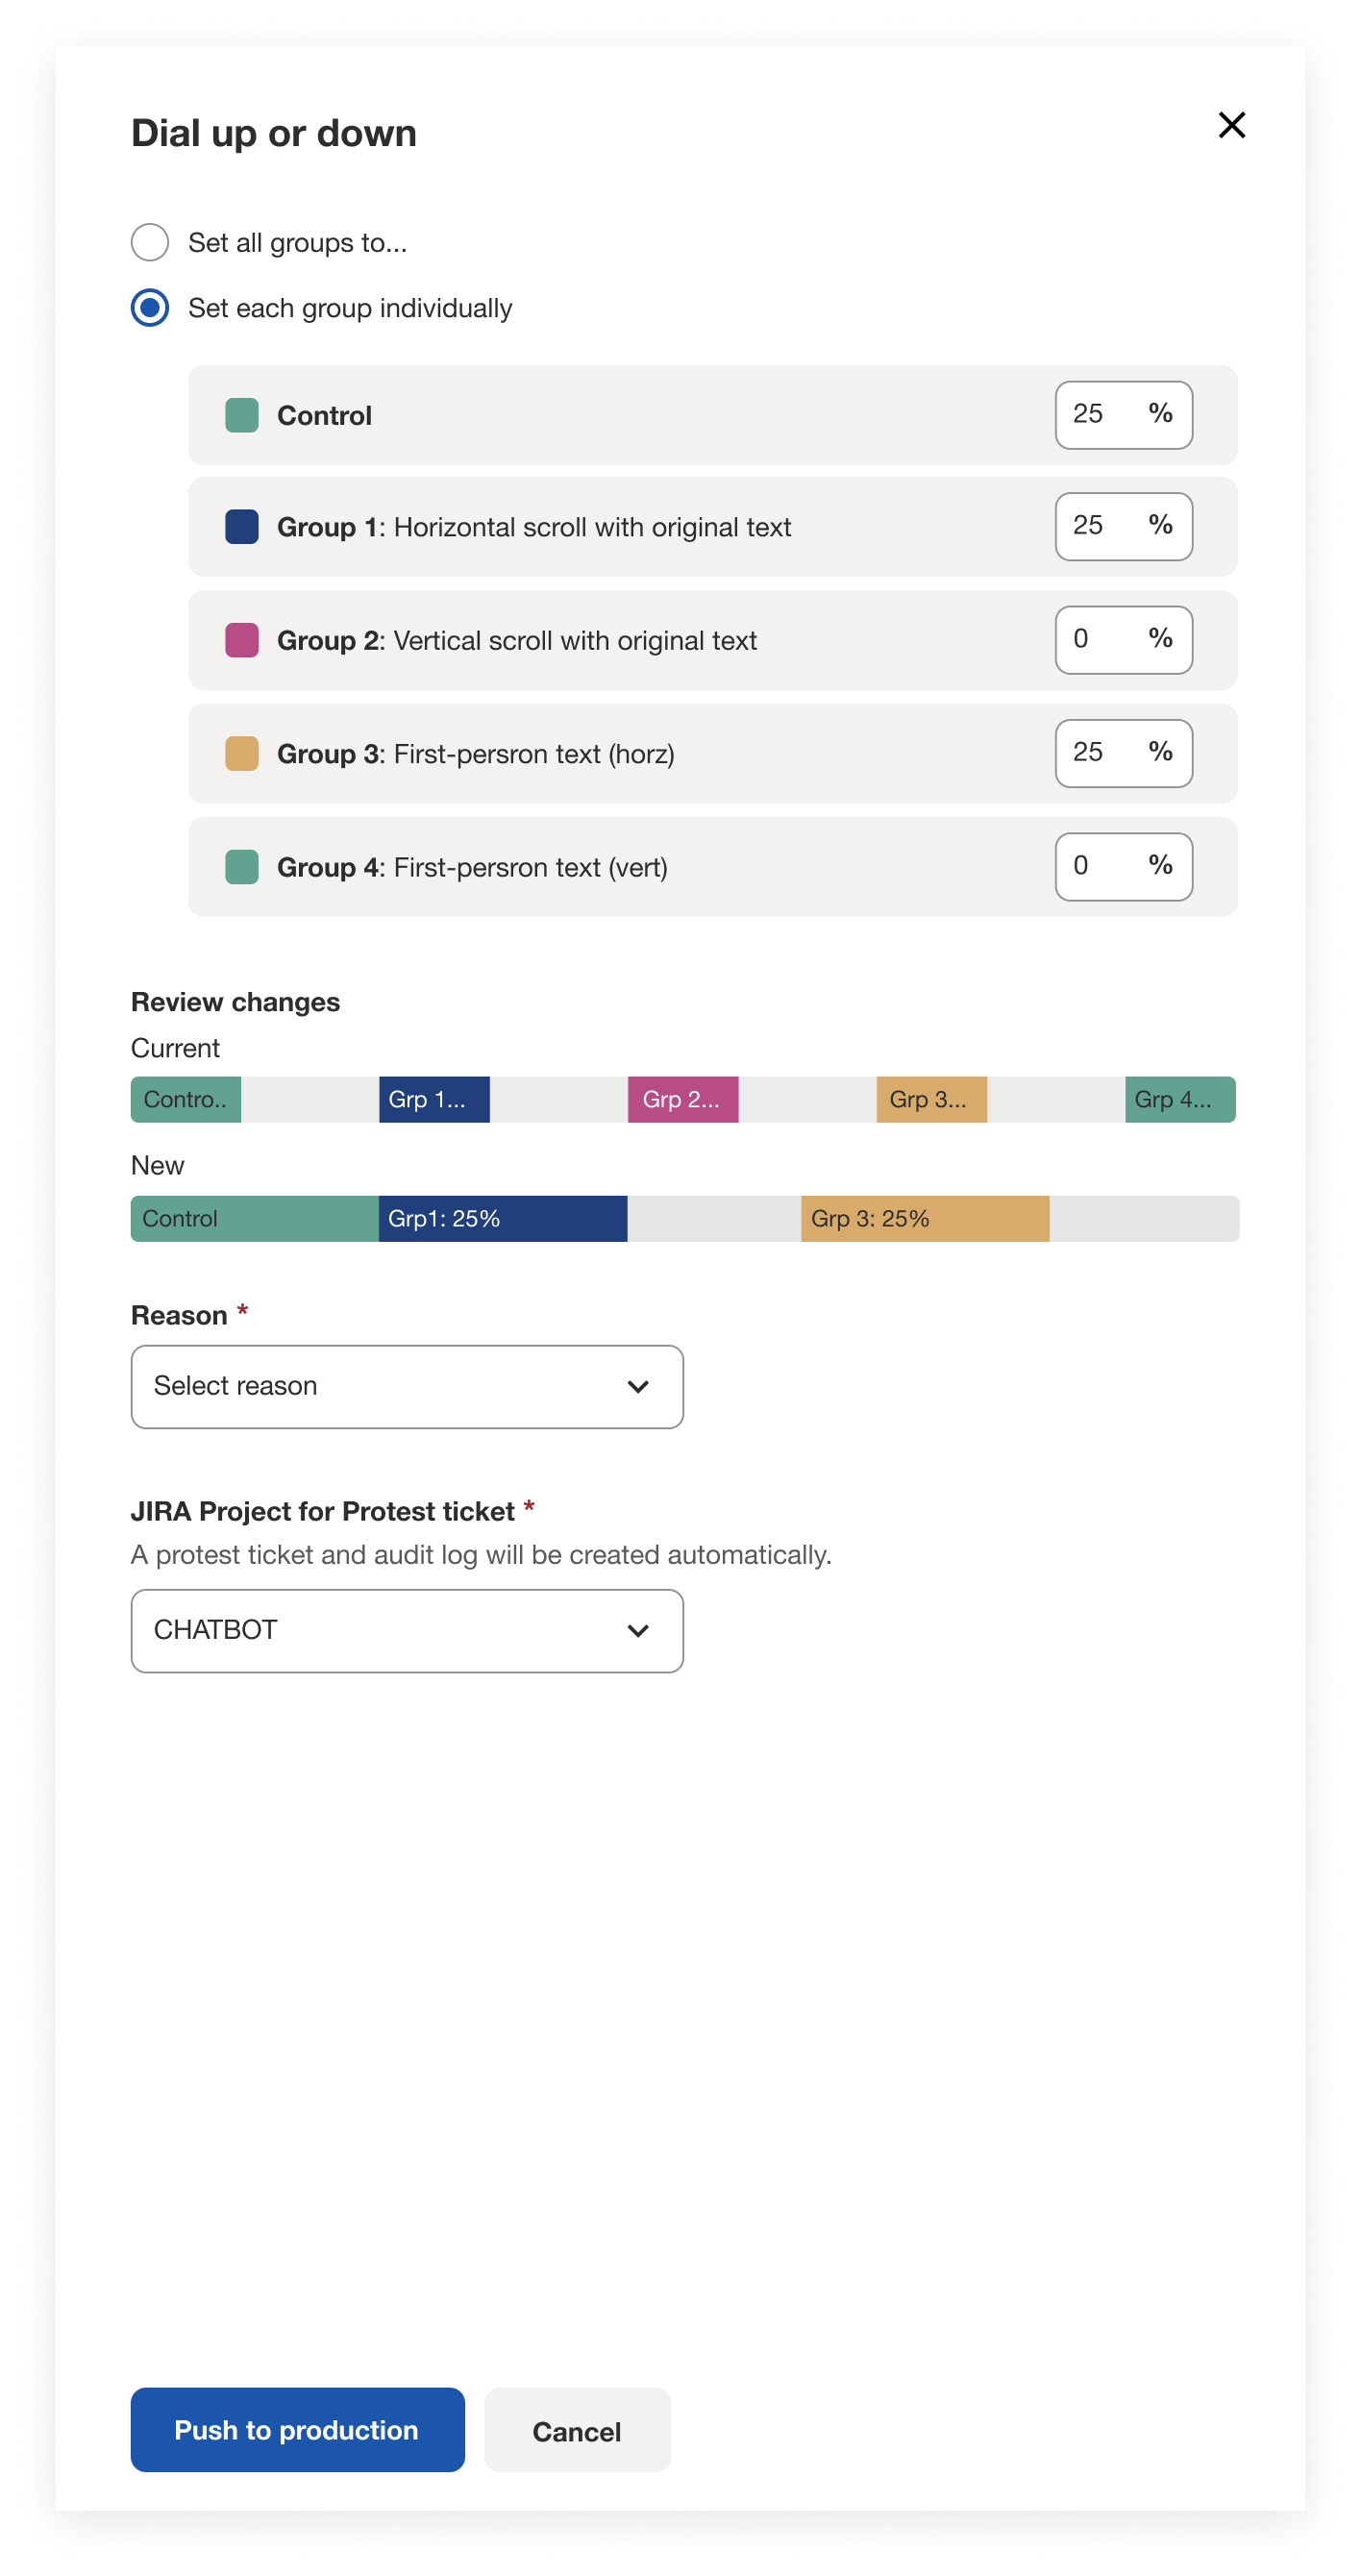
Product managers loved these features introduced to help save time.
Dial-up/down
“The magic button? I love it!” — Jobseeker team PM
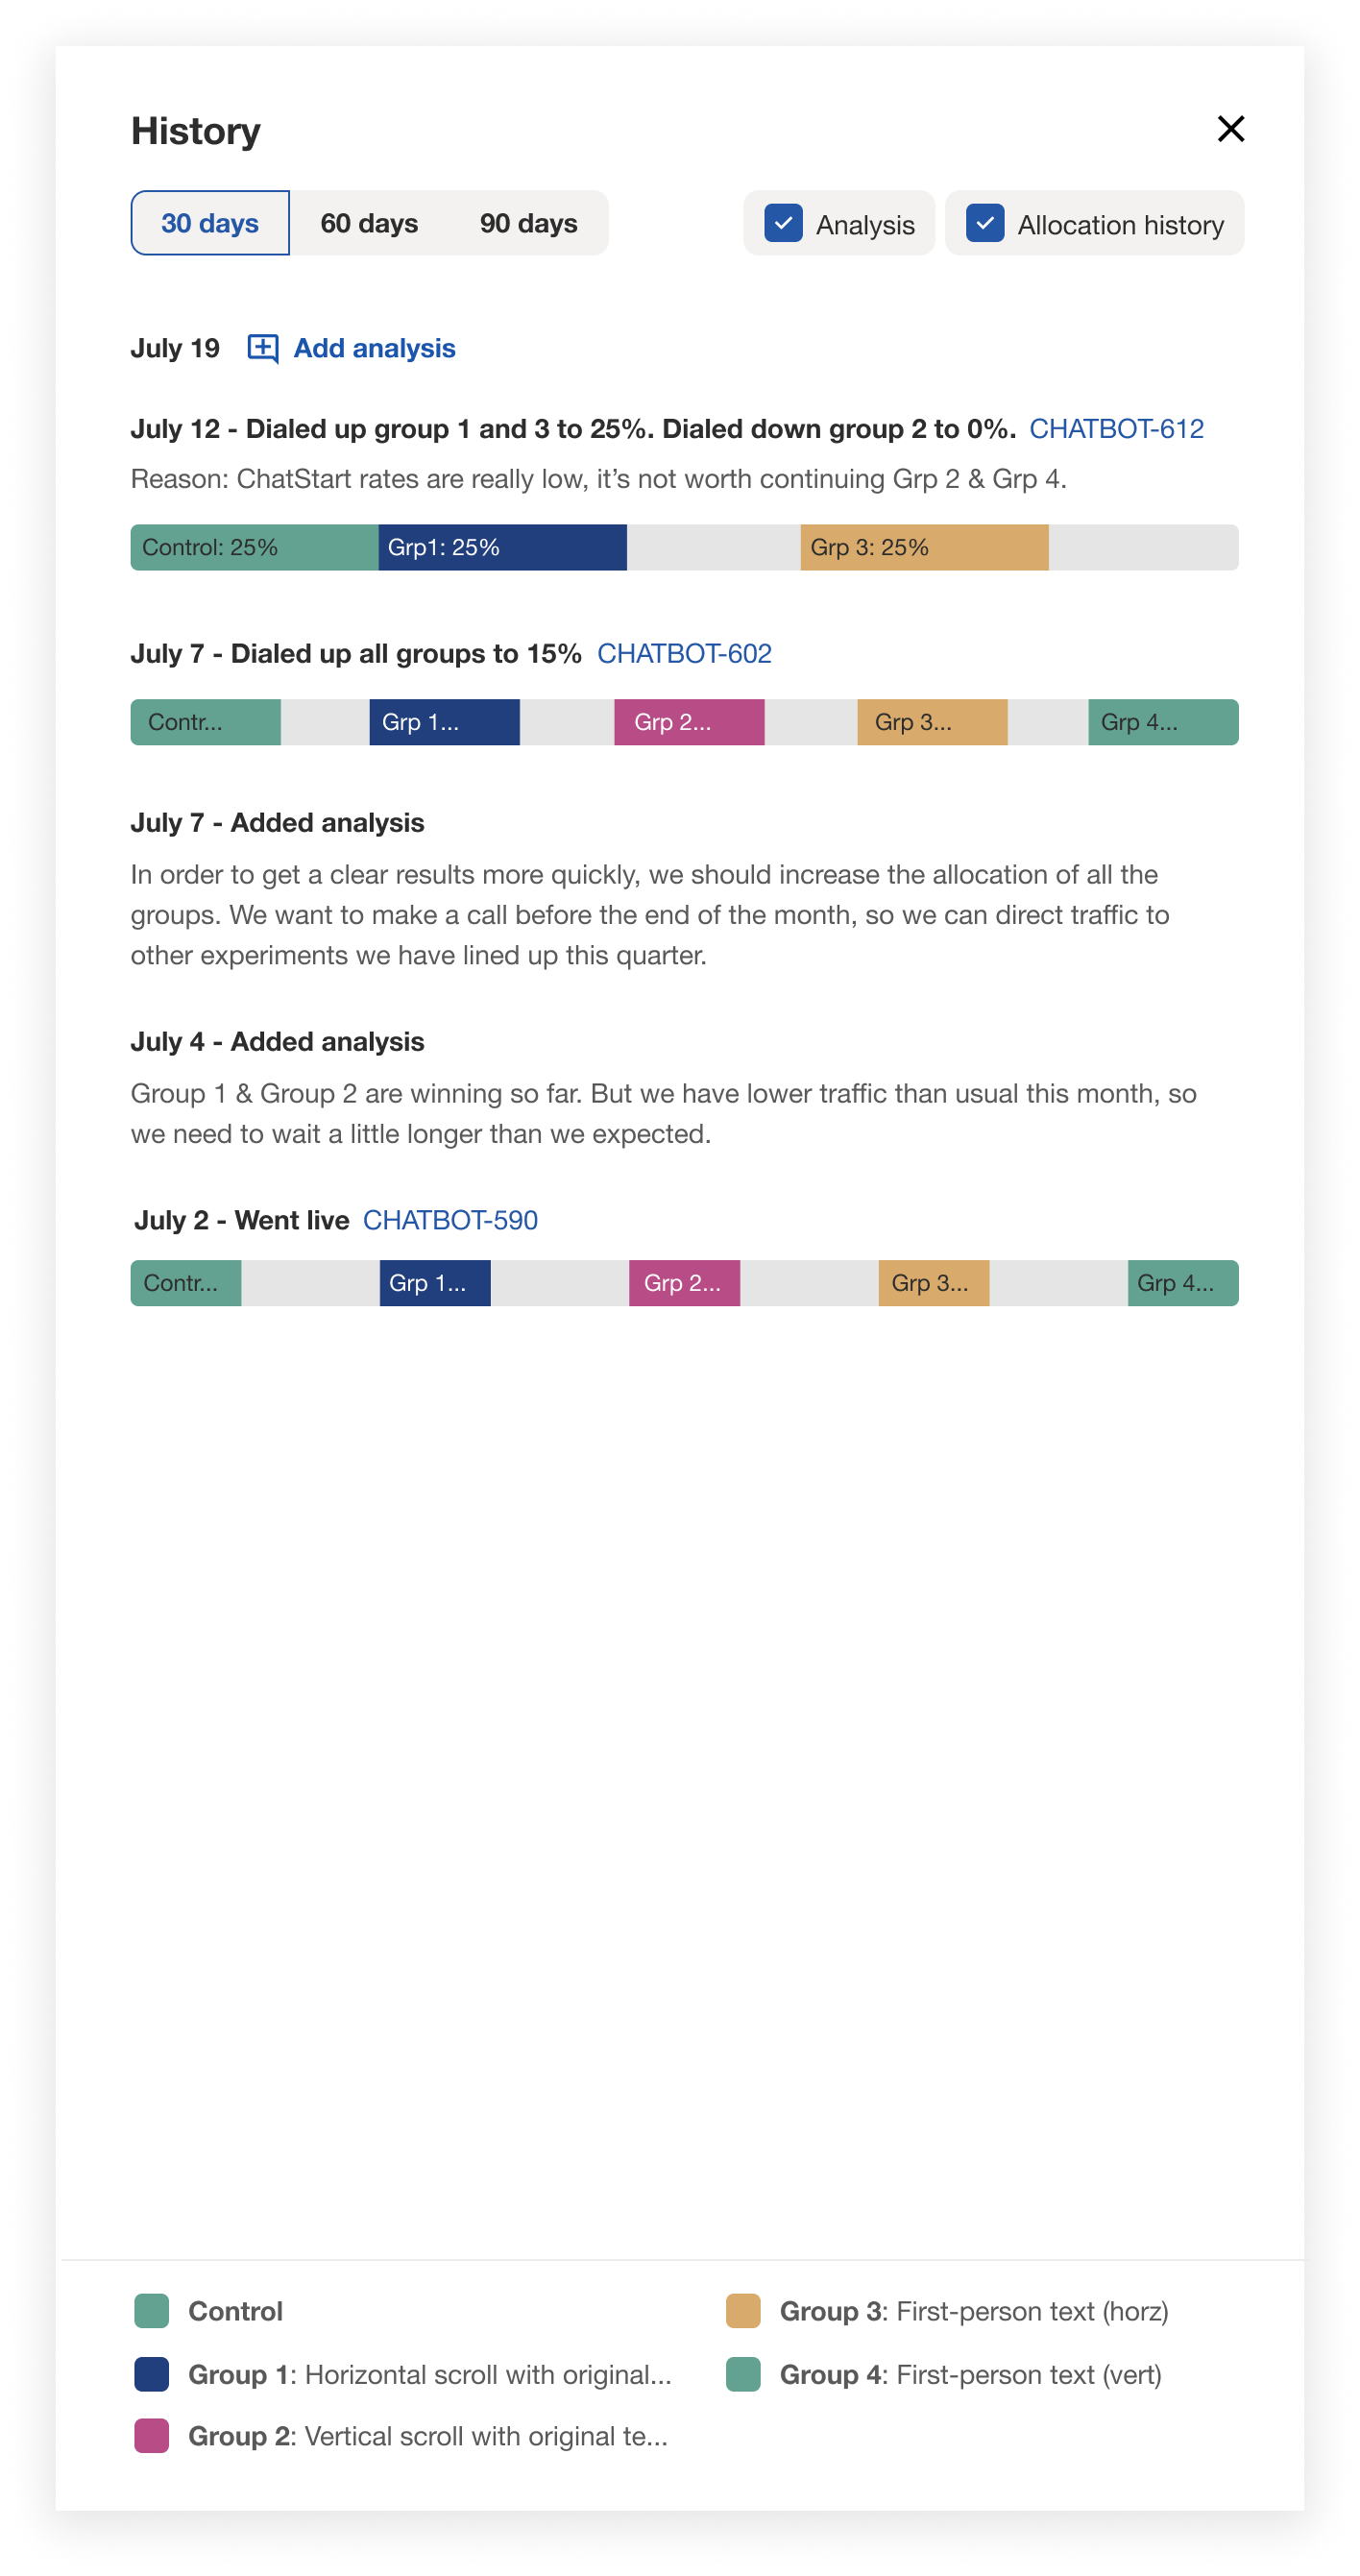
History
“Saw this yesterday… Sooooo useful!” - SMB PM
DESIGN DETAIL EXPLORATION
Make data easy to understand and actionable.
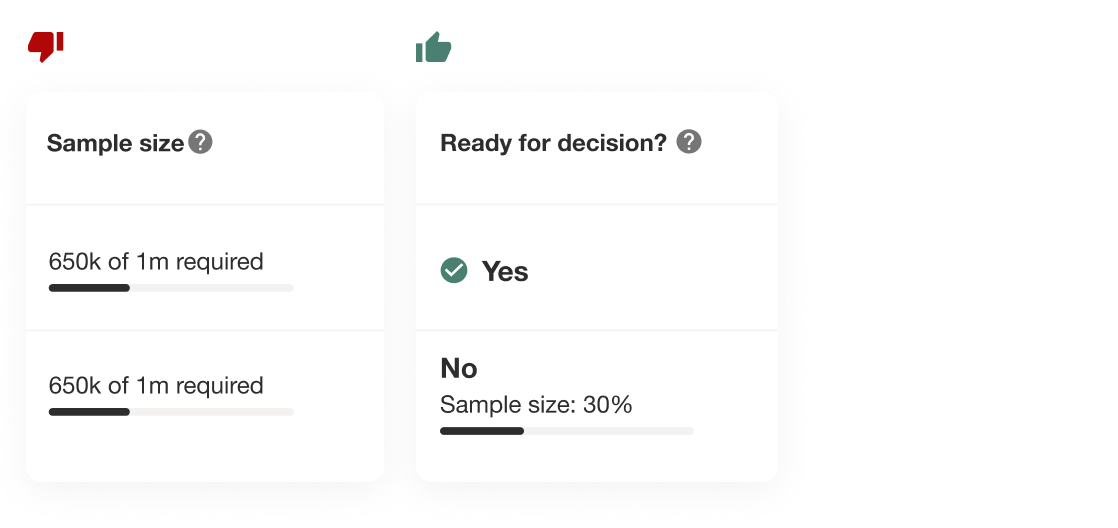
Sample size
When I tested showing sample size, PMs didn’t understand that they can use this data to determine when the experiment is ready for analysis. I reframed the sample size to be more actionable.
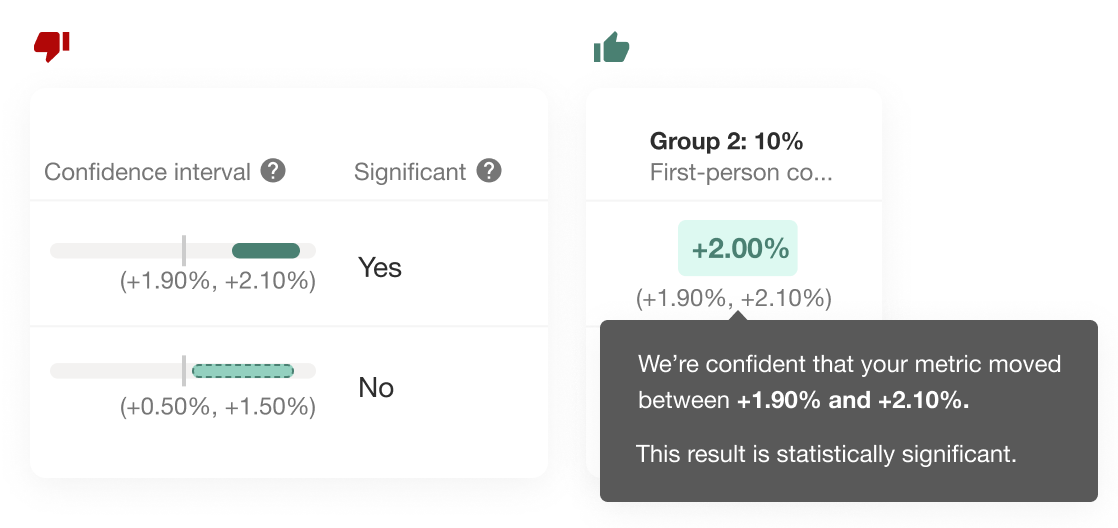
Confident interval
Although I used a standard confident interval visualization, some PMs didn’t know how to read this. So, I decided to use a text explanation on hover instead. This was more clear and helpful.
STATUS & RESULT
72% of PMs now use the analysis tool.
The search feature, JIRA automation, and all of the analysis tool improvements were launched.